Youth Football KPIs for Coaches: 6–8 Metrics, No Overhaul
Published 16 October 2026

Track three domains, technical, physical and tactical, and keep each player to a shortlist of six to eight metrics rather than a sprawling dashboard. Practitioner guidance on limiting tracked events backs that discipline. Then read every number against biological maturity and the player’s own trend over months, because a single raw figure from one match rarely tells you what you think it does.
TL;DR:
- For wingers, track dribbling success and chance creation from wide areas; for center backs, measure pressured forward passes and defensive third recoveries.
- Advanced maturers can show vertical jump advantages of 5–10 cm and VO2max differences of 5–10 mL/kg/min, so raw physical comparisons can reward temporary growth.
- Combine GPS with session RPE and recovery checks: matches produced more sprint and high speed running exposure, while training sessions often elicited greater perceived exertion.
- Capture each match, summarize load weekly, test technical skills monthly, and review quarterly; scouting before age 14–15 is unreliable.
- Pilot one player KPI and one team KPI, link each to a training action, and present progress as development rather than ranking.
Table of Contents
- What are youth football KPIs and why do they matter?
- Which KPI domains should you track, and for which positions?
- What does a 6–8 KPI shortlist look like in practice?
- How do you account for maturation and relative age?
- How should you collect and track the data?
- How do you read the numbers without being misled?
- Why starting small beats a perfect system
- How can a gamified platform run your KPI programme?
- FAQ
- Sources
What are youth football KPIs and why do they matter?
A youth football KPI is a measurable, time-bound indicator tied to a development goal. “Completes more passes in the final third over a twelve-week block” is a KPI. “Plays well” is not. Good ones tell you what to coach next, which is the whole point.
Development KPIs differ from scouting or selection numbers. Selection asks who is best today, which tends to reward whoever has matured earliest. Development asks who is improving and what that player needs from Tuesday’s session. The same data can serve both, but the questions, and the way you read it, are different.
The most useful discipline is restraint. Published work on attacking KPIs from elite to youth academy level recommends tracking no more than 6–8 key events, because coaches who track everything end up acting on nothing. The same work notes that practitioners lean towards event data such as shots, passes and dribbles, alongside external-load measures like high-speed running, sprints and accelerations. That mix is the backbone of this toolkit: a few events, a few load indicators, one clear coaching action for each.

Which KPI domains should you track, and for which positions?
Group your indicators into technical, physical and tactical domains, then pick examples that fit the role.
Technical: pass completion in the final third, successful 1v1 take-ons, and shot quality, using a simple expected-threat style proxy if your video coding allows it.
Physical (external load): high-speed running distance, sprint counts, and accelerations and decelerations, usually from GPS.
Tactical and decision-making: forced turnovers, time to regain possession, and chance-creation actions. A systems approach to performance analysis singles out time to regain possession and forced turnovers as important but under-measured areas.
Position-aware examples to start from:
- Goalkeeper: distribution accuracy to the first line, and successful claims of crosses in the box.
- Full back: sprint count on overlaps, and defensive 1v1 success.
- Centre back: forward pass completion under pressure, and recoveries in the defensive third.
- Midfield: forced turnovers, and progressive pass completion between thirds.
- Winger: successful take-ons, and chance-creation actions from wide areas.
- Forward: shot quality, and sprint count in behind the line.
Keep two or three per role. A winger tracked on too many things is tracked on nothing.
What does a 6–8 KPI shortlist look like in practice?
Here is a player-level shortlist you can adopt this week, mixing the three domains with one subjective load measure:
- Pass completion in the final third: shows composure in the decisive area, so it drives passing-under-pressure practices.
- Successful take-ons: shows 1v1 confidence, so it guides small-sided games with limited touches.
- Sprint count: shows repeated explosive output, so it informs conditioning blocks.
- Top speed: shows peak output, so it flags when sprint exposure is too low.
- Acceleration bursts: show change-of-pace ability, so they shape short, sharp drill design.
- Decision-quality rating: a coach-scored assessment of choices in possession, which supplies the feedback cue after each match.
- Session-RPE: the player’s own rating of effort, which tells you when to ease or add load.
At team level, a small number of indicators is plenty:
- Possession progression per third of the pitch, to see where moves stall.
- Forced turnovers, to judge pressing intent.
- Time to regain possession, to judge how quickly the team reorganises.
- Expected chances created, to judge the quality of attacks rather than the count.
Each metric earns its place only if you can name the session it changes. If you cannot, drop it.
How do you account for maturation and relative age?
Maturation is the largest trap in youth data. Early developers look quicker, stronger and fitter, and those advantages fade. As Sean Cumming explains for the FIFA Training Centre, early developers are often chosen for temporary physical edges, so coaches should lean on technical and tactical indicators and adjust for biological age. His recommended remedy is bio-banding, which groups players by biological maturity rather than birth date.
The scale of the gap is not small. Research on age- and size-corrected technical measures reports that advanced-maturing players can show vertical jump advantages of 5–10 cm and VO2max differences of 5–10 mL/kg/min.
Simple proxies such as predicted peak height velocity help, but use them with care. A review of performance assessment and maturation status found weak links between simple pubertal measures and many physical tests, so treat any single maturity estimate as a rough guide.
Pro Tip: Compare each player’s trajectory over several months and against maturity-matched peers, never a single match’s raw numbers against the whole squad.

How should you collect and track the data?
Match your tool to the metric, then set a rhythm you can actually sustain:
- Event coding from video: passes, take-ons, turnovers and chances, captured every match.
- GPS: high-speed running, sprints and accelerations, summarised weekly.
- Heart rate and session-RPE: internal load after each session.
- Recovery ratings such as TQR: a quick pre-session check on readiness.
Research on a standard microcycle in sub-elite youth players shows why you need both sides. Matches produced higher high-speed running and sprint exposure, while training sessions often produced higher perceived exertion. External numbers alone would have missed that, so combine external load, internal load and recovery.
A workable cadence: match capture every game, weekly load summaries, monthly technical tests, and a quarterly development review. Protect data quality by fixing definitions early (what counts as a “successful” take-on?) and by keeping reports concise and easy for a coach to read.
How do you read the numbers without being misled?
An isolated metric misleads. The recent integrated interpretative framework for youth football describes “contextual synchronisation”: aligning biological state, training load and technical outcomes over time instead of judging one variable alone.
Two short examples show the difference. A winger’s take-on success climbs across a term while sprint load stays flat: that points to genuine technical learning. Another player’s sprint count jumps sharply in a single season with no change in training: that points to a growth spurt, so do not credit your programme or write off his peers.
Three pitfalls to avoid:
- Leaning on single-game stats.
- Ignoring maturation when comparing players.
- Collecting more metrics than anyone analyses.
Be careful with structured scouting too: guidance from the FIFA Training Centre on how scouts assess players warns that judging talent before age 14–15 is unreliable, so use numbers to support coach judgement, never replace it.
Why starting small beats a perfect system
In our experience of how coaching staff adopt data, the programmes that survive are the modest ones. Begin with a player KPI and a team KPI for a short pilot. Pair every number with a single coaching action, keep the report to a page, and resist adding a metric until the first two have changed something on the training pitch. When you talk to players and parents, frame the figures as a record of growth and the next small target, never a ranking. Young athletes who see progress against their own earlier selves stay engaged, while those compared with an early developer quietly switch off.
— Chris
How can a gamified platform run your KPI programme?
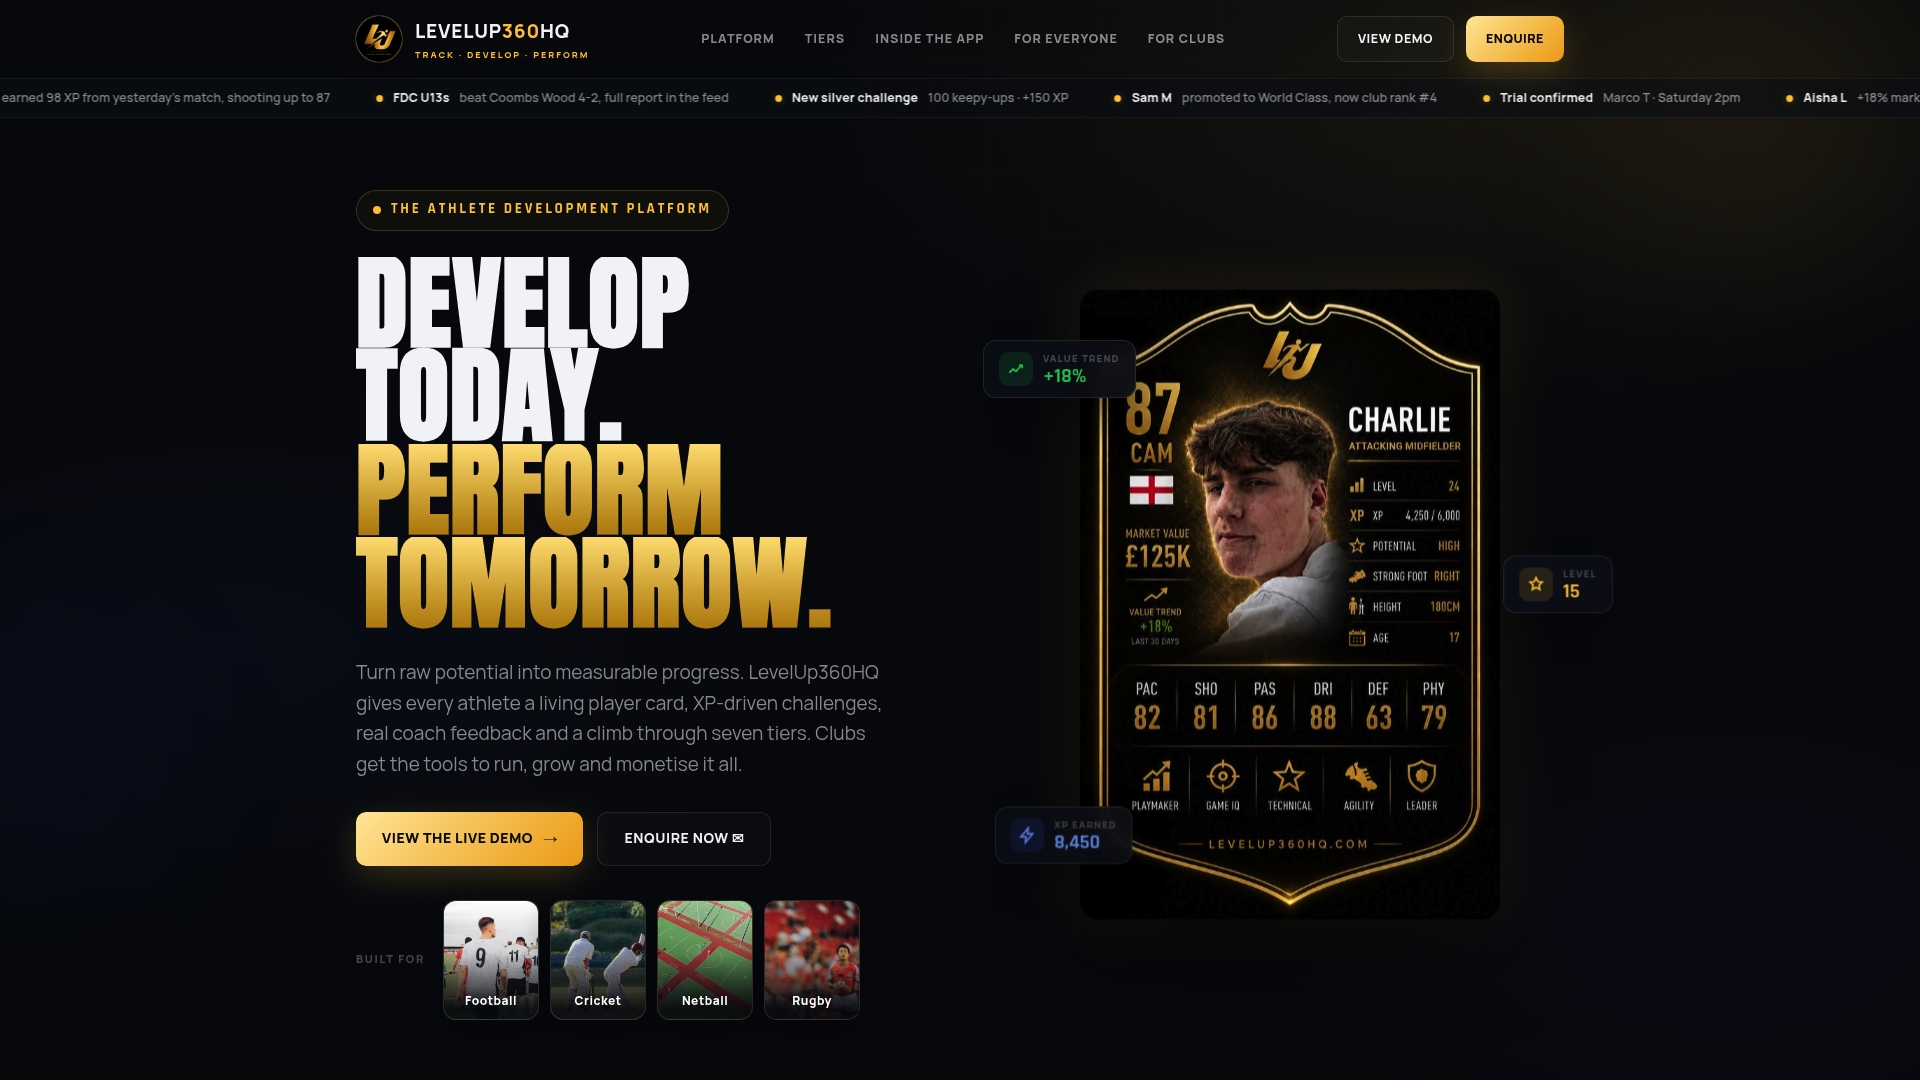
We built LevelUp360HQ so the workflow above lives in one place. Our live player cards carry real-time ratings, our video assessments and approval workflows give coaches a clear route from observation to feedback, and our session management and analytics keep longitudinal data together instead of scattered across spreadsheets. Players see their own progress and tiers, which supports engagement. If you want to see how it fits your academy, book a demo and we will walk you through it.
FAQ
What is a performance profile in football and how is it used?
A performance profile is a one-page summary of a player’s key technical, physical and tactical indicators tracked over time. Coaches use it to spot strengths, set the next development targets and check progress against the player’s own earlier results.
How do you come up with KPIs for youth football?
Start from the development goal, then choose a small number of measurable indicators across the three domains. Practitioner guidance recommends keeping to 6–8 key events, and each metric should link to a specific coaching action.
What is an example of performance analysis in youth football?
A coach codes every match for final-third pass completion and forced turnovers, summarises weekly sprint counts from GPS, and reviews the trends each quarter. The numbers are read alongside maturity and training load before any decision is made.
Should maturation change how I read KPIs?
Yes. Physical numbers in particular reflect biological age as much as ability. Use bio-banding or maturity-aware comparisons and judge players on trajectory over months rather than single-match output.
Sources
- Using Age- and Size-Corrected Measures of Technical Skill to Better Assess the Performances of Youth Soccer Players
- Attacking Key Performance Indicators in Soccer: Current Practice and Perceptions from the Elite to Youth Academy Level
- Sean Cumming on maturation in youth football - FIFA Training Centre
- Beyond isolated metrics and the data deluge: an integrated interpretative framework for youth football development: Science and Medicine in Football: Vol 0, No 0 - Get Access
- What’s in a game? A systems approach to enhancing performance analysis in football | PLOS One
Turn potential into a player card.
LevelUp360 tracks every match, builds your child's player card, and shows their development over time.
Get started free