Why track performance metrics as an athlete
Published 5 June 2026
Tracking performance metrics as an athlete means systematically recording objective data about your training and competition outputs to separate genuine progress from short-term noise. Subjective feelings lie. You might feel strong on a day your output is declining, or feel flat on a day your body is primed to perform. Objective data replaces guesswork with evidence, giving you and your coach a reliable basis for every training decision. Tools like velocity-based training (VBT) devices, heart rate monitors, and platforms such as Levelup360hq make this process accessible at every level of sport.
Why track performance metrics as an athlete?
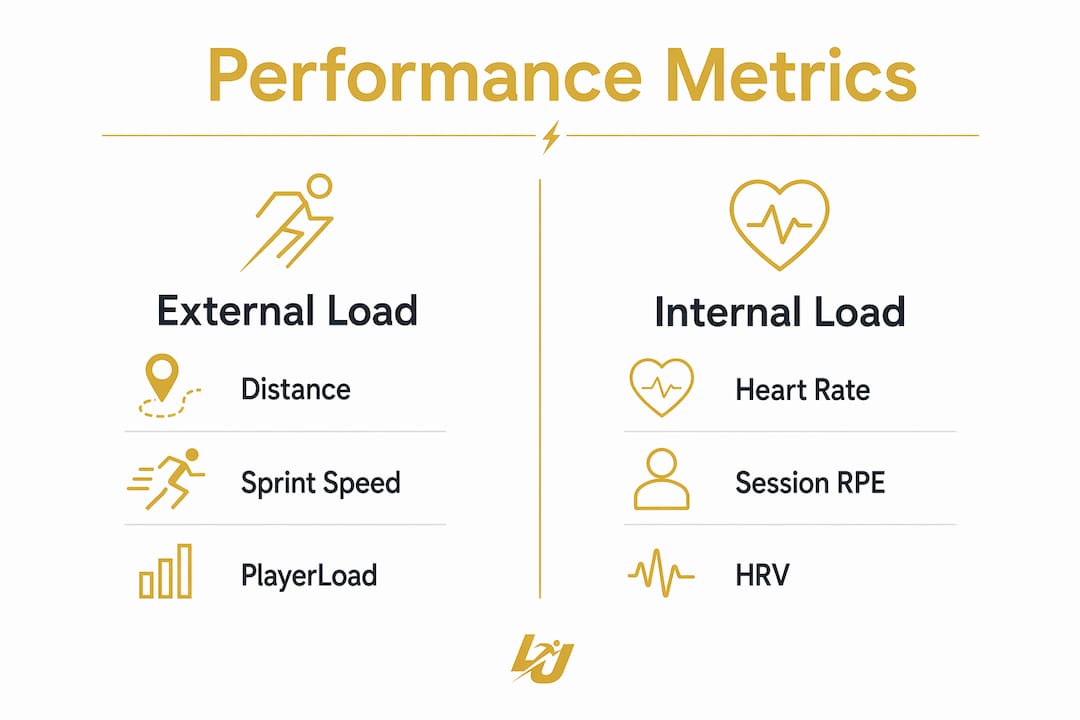
Performance metrics in sport fall into two broad categories: external load and internal load. Understanding both is the foundation of any serious monitoring system. External load describes what you physically did. Internal load reveals how your body responded to it. Neither tells the full story alone.
External load metrics include distance covered, sprint velocity, PlayerLoad (a composite of accelerations and decelerations), and barbell velocity. These are typically captured by GPS or GNSS devices, inertial measurement units (IMUs), or velocity sensors. Internal load metrics include heart rate, heart rate variability (HRV), session rating of perceived exertion (session-RPE), and Training Impulse (TRIMP). Internal and external load metrics answer different but equally important questions about your workload and physiological response.
Beyond these two categories, neuromuscular markers add a third dimension. Countermovement jump (CMJ) height and velocity loss (VL) during a set both signal how fatigued your nervous system is. These markers are particularly useful for strength and power athletes who need to know whether their nervous system has recovered before loading it again.
| Metric type | Example metrics | Typical measurement tools |
|---|---|---|
| External load | Distance, sprint velocity, PlayerLoad | GPS units, IMUs, timing gates |
| Internal load | HR, HRV, session-RPE, TRIMP | Heart rate monitors, wellness apps |
| Neuromuscular | CMJ height, velocity loss | Force plates, VBT sensors |
| Subjective | Mood, sleep quality, perceived fatigue | Wellness questionnaires, apps |
Pro Tip: Start with one metric from each category rather than tracking everything at once. A single velocity reading per session, a daily HRV score, and a weekly jump test give you more useful signal than twenty inconsistently recorded variables.
How do performance metrics improve training adaptation and injury prevention?
The most direct benefit of tracking is that it replaces guesswork with reliable evidence of progress or regression. A 5% increase in barbell velocity at a fixed load, or a two-second improvement in a sprint split, is real. A feeling that you are getting stronger is not. Small, quantifiable wins like these keep athletes motivated and adherent to their programmes over months and years.
Injury prevention is where metrics deliver some of their most significant value. A 2025 systematic review found that multi-variable internal load monitoring links significantly with lower injury incidence in elite football. The mechanism is straightforward: sudden spikes in workload without adequate recovery are a primary driver of overuse injuries. When you track accumulated load week on week, you can see a dangerous spike before it becomes a problem.
Velocity loss thresholds are particularly useful for managing fatigue within a session. Velocity loss above 30% sharply increases blood lactate and requires more than 24 hours for neural recovery. Staying near that threshold yields the best balance of hypertrophy and power development without accumulating excessive fatigue. This is not a theoretical principle. It is a practical cutoff you can apply in every strength session with a basic VBT sensor.
Tracking also supports smarter fatigue management across training blocks. When you can see that your velocity is drifting downward across consecutive sessions, you have objective grounds to reduce volume before your body forces the decision through injury or illness.
What is the role of readiness and recovery markers in performance tracking?
Readiness markers tell you whether your body is prepared to absorb a training stimulus on any given day. The most commonly used are resting heart rate and HRV. Both are sensitive to sleep quality, stress, illness, and accumulated fatigue. The problem is that single-day values are noisy. One poor night of sleep will tank your HRV reading without telling you anything meaningful about your training status.
Weekly rolling averages based on three to four measurements over 12 to 24 hours provide a far more stable and actionable readiness signal. A meaningful drop from your personal baseline over several days is a genuine flag. A single low reading on a Monday morning is probably just Monday.
HRV is most effective as an early recovery indicator when integrated with symptom tracking and multi-day baselines. Used in isolation, it misleads more than it guides. Pair it with a simple wellness questionnaire covering sleep, mood, muscle soreness, and energy, and you have a picture that is genuinely useful for adjusting that day’s session volume or intensity.
Pro Tip: Measure your resting heart rate and HRV at the same time each morning, ideally before getting out of bed. Standardising measurement conditions reduces short-term noise and makes your baseline far more reliable over time.
VBT adds an autofeedback loop to this process. Velocity drift across warm-up sets, where your bar speed at a given load is slower than your established baseline, signals neural fatigue before you have even started your working sets. This allows you to make real-time decisions about session intensity rather than committing to a volume that your body cannot currently absorb.
Which tools make athlete performance tracking practical?
The barrier to meaningful performance tracking is lower than most athletes assume. You do not need a sports science laboratory. You need consistency and a small set of well-chosen tools.
- Training log. A structured log recording sets, reps, load, and a session-RPE score after every session is the minimum viable tracking system. A spreadsheet or a dedicated app works equally well.
- Velocity sensor. Devices like GymAware or PUSH Band attach to a barbell and measure rep velocity in real time. Barbell velocity at fixed loads detects strength changes of 2 to 3%, which is far more sensitive than waiting for a new one-rep maximum.
- Heart rate monitor. A chest strap or optical wrist monitor captures resting HR and HRV each morning and session-level cardiovascular load during training.
- Jump mat or force plate. Weekly countermovement jump testing takes under two minutes and gives you a reliable neuromuscular readiness marker.
- Athlete development platform. Software platforms like Levelup360hq consolidate velocity data, heart rate logs, wellness scores, and training history into a single view. This is where raw numbers become actionable performance analysis rather than a pile of disconnected spreadsheets.
The most common mistake athletes make is tracking too many metrics inconsistently. Fifteen variables measured sporadically produce worse decisions than three variables measured every session without fail. Choose your metrics, standardise your testing conditions, and commit to the process for at least four weeks before drawing any conclusions.
Pro Tip: Build a performance tracking workflow around your existing training schedule rather than adding separate testing sessions. A velocity warm-up set, a morning HRV reading, and a post-session RPE score add fewer than five minutes to your day.
How to interpret and apply metrics to optimise training
Raw numbers are not decisions. Interpretation is where performance analysis for athletes becomes genuinely powerful. The key principle is that trends over two to four weeks carry meaningful signal. Day-to-day variation in metrics is normal and should not drive programming changes.
When reading your data, apply these principles:
- Look for directional trends, not single sessions. A velocity that has declined across three consecutive sessions is a signal. A single slow session after poor sleep is noise.
- Use velocity loss cutoffs per lift. A 20% velocity loss threshold suits power-focused phases; 30% suits hypertrophy blocks. Adjust the cutoff to match your training goal, not a generic standard.
- Contextualise data with sport demands. No single universal metric suits every sport. Endurance performance correlates strongly with TRIMP and high-intensity heart rate time. Strength and power adaptations require neuromuscular markers. Select metrics that reflect what your sport actually demands.
- Integrate athlete intuition. Data informs decisions. It does not replace the athlete’s lived experience or the coach’s contextual judgement. A metric that consistently contradicts how an athlete feels deserves scrutiny, not blind obedience.
- Use metrics to time your taper. In the two weeks before competition, rising velocity at submaximal loads and recovering HRV are reliable signals that your body is peaking. These are the numbers that tell you the taper is working.
The athletes who extract the most value from metrics are not those with the most sophisticated equipment. They are the ones who have built a consistent habit of recording, reviewing, and adjusting over months and years.
Key takeaways
Tracking performance metrics works because objective data distinguishes real adaptation from short-term fluctuation, enabling smarter training decisions, injury prevention, and peak performance timing.
| Point | Details |
|---|---|
| Use both load types | Combine external and internal load metrics to get a complete picture of training stress and physiological response. |
| Apply velocity loss thresholds | Keep velocity loss near 30% per set to balance fatigue and maximise adaptation without excessive neural cost. |
| Average readiness markers | Use rolling three to four day HRV and resting heart rate averages rather than reacting to single-day readings. |
| Prioritise consistency over volume | Track three to five metrics every session rather than fifteen metrics sporadically for reliable, usable trends. |
| Contextualise before acting | Interpret data trends over two to four weeks and always combine objective markers with athlete and coach judgement. |
The honest truth about data and athletic development
I have spent years watching athletes collect data they never use and coaches build dashboards nobody reads. The problem is rarely a lack of technology. It is a lack of clarity about what question the data is supposed to answer.
The athletes I have seen benefit most from metric tracking are not the ones with the most sensors. They are the ones who picked two or three numbers that genuinely reflected their training goals and checked them every single week without fail. A footballer tracking sprint velocity and session-RPE across a season will learn more about their own development than one who logs twenty variables for three weeks and then stops.
There is also a motivational dimension that gets underestimated. Seeing a 4% improvement in jump height after six weeks of consistent training is far more powerful than a coach telling you that you are improving. The data makes the progress undeniable. That matters enormously for athletes who train through doubt, fatigue, and the inevitable plateaus that every development journey contains.
My honest view is that the future of athlete development belongs to platforms that make this process frictionless. Not because technology replaces coaching judgement, but because it frees coaches and athletes to spend their mental energy on decisions rather than data collection. The metric is not the point. The decision it enables is.
— Chris
Track, develop, and perform with Levelup360hq
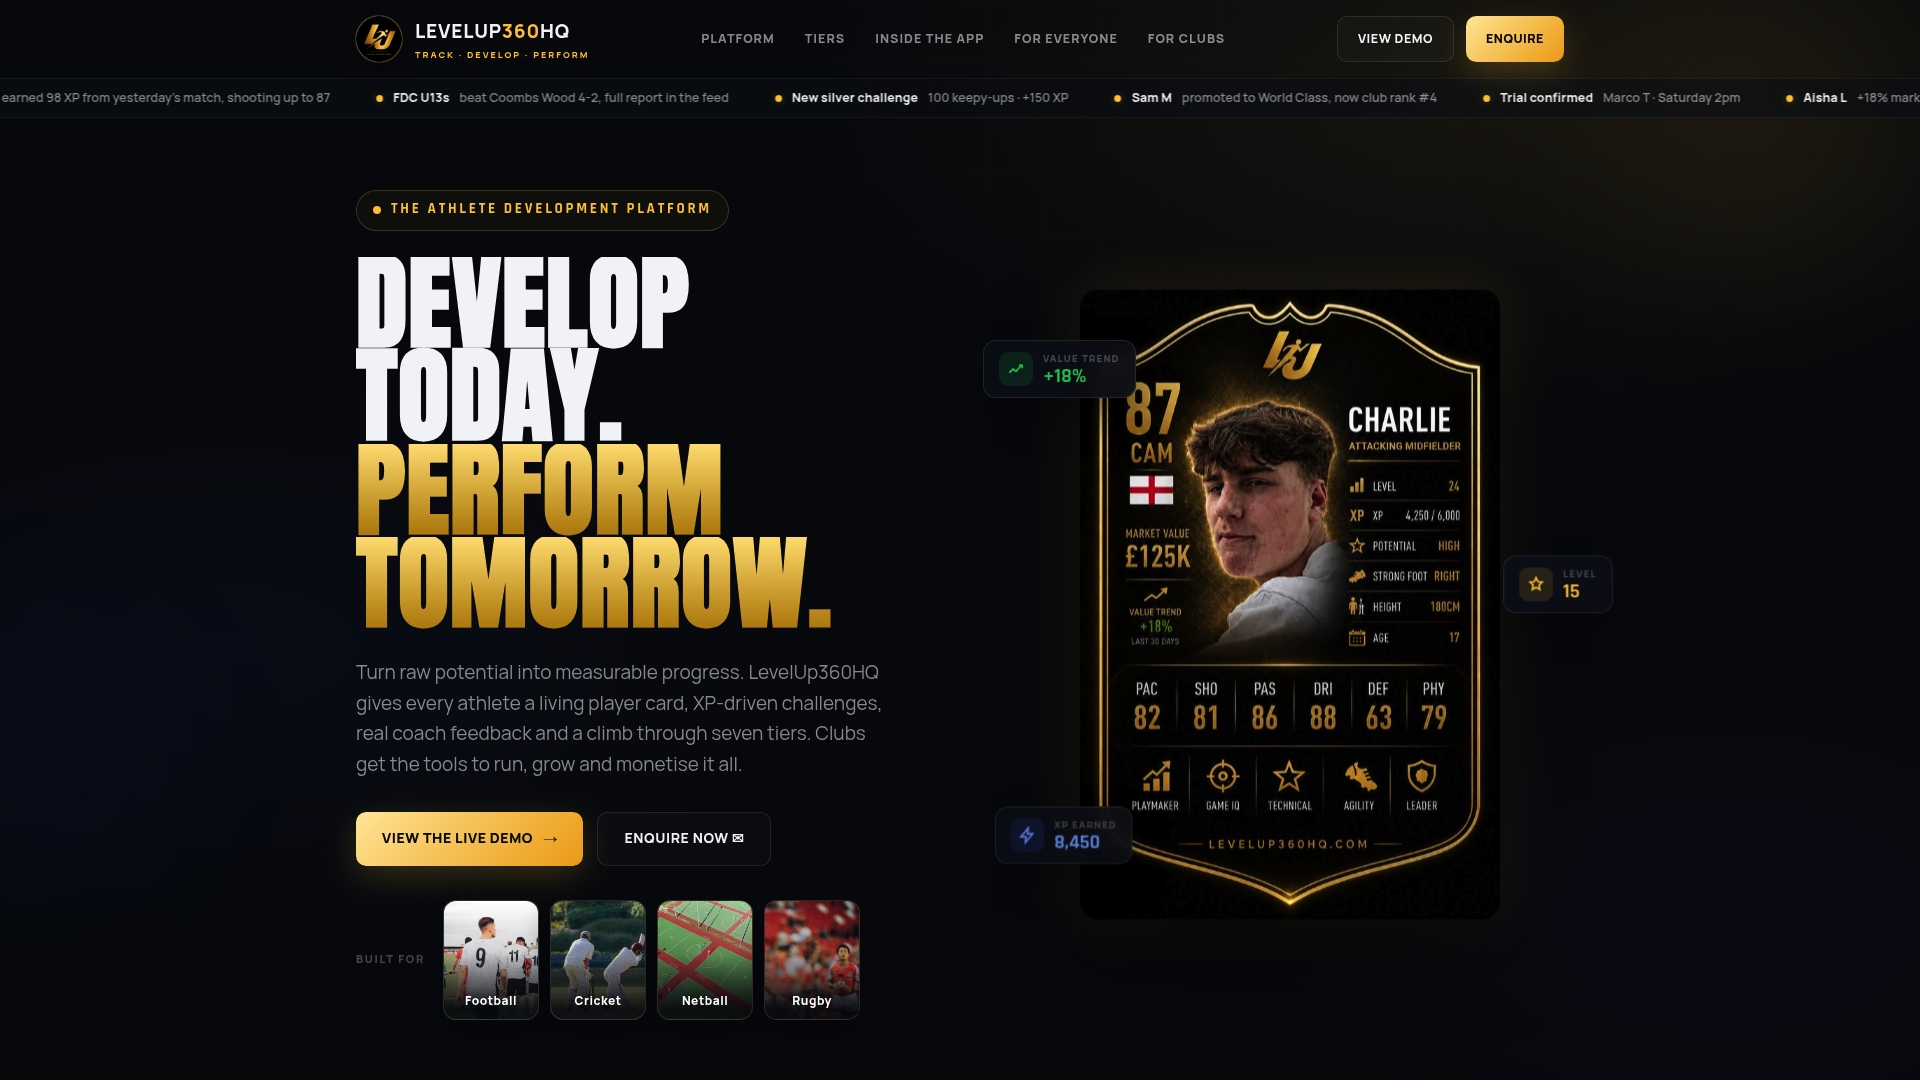
Levelup360hq is built for athletes who want their performance data to mean something. The platform consolidates training logs, velocity data, heart rate metrics, and wellness scores into a single athlete profile, complete with FIFA-style player cards that update in real time as your numbers improve. Coaches get video assessment tools, session management, and approval workflows. Clubs get white-label branding and CRM functionality. Whether you play football, cricket, netball, or rugby, Levelup360hq turns raw metrics into visible progress. Explore the platform to see how your data can drive your development, or try the demo to experience the tracking tools firsthand.
FAQ
What are the most important performance metrics for athletes to track?
The most important metrics depend on your sport, but a practical starting set includes barbell velocity or sprint speed (external load), session-RPE (internal load), and resting HRV (readiness). These three cover training output, physiological response, and recovery status without creating data overload.
How often should athletes measure their performance metrics?
Session-RPE and training load should be recorded after every session. HRV and resting heart rate are most reliable when measured daily first thing in the morning and reviewed as a rolling weekly average rather than individual readings.
Can tracking metrics actually reduce injury risk?
A 2025 systematic review confirmed that multi-variable internal load monitoring links significantly with lower injury incidence in elite football. The mechanism is early detection of workload spikes before they accumulate into overuse injuries.
What is velocity-based training and why does it matter for tracking?
Velocity-based training uses sensors to measure barbell speed during lifts, detecting strength changes of 2 to 3% at submaximal loads. This means you can monitor strength progress and fatigue in real time without performing risky maximal effort tests.
How do I avoid being overwhelmed by too much data?
Choose three to five metrics that directly reflect your training goals, measure them consistently under the same conditions, and review trends over two to four week blocks rather than reacting to individual sessions. Consistency of measurement matters more than the number of variables tracked.
Recommended
Turn potential into a player card.
LevelUp360 tracks every match, builds your child's player card, and shows their development over time.
Get started free