Athlete retention in sports clubs: a practical guide
Published 12 August 2026

Athlete retention is the proportion of players who remain actively engaged with a club over a defined period. For a club manager, that single figure tells you more about organisational health than your membership sign-up numbers ever will. A club that recruits well but retains poorly is essentially running a leaky bucket, with money, coaching time, and community goodwill draining out faster than they accumulate. The Sport Participation Pathway Model (SPPM) frames retention as a flow problem across life stages, and its data makes the stakes concrete: across a three-year analysis of eight major sports, roughly 50.8% of participants played continuously while 44.7% dropped out entirely. Nearly half. The simplest metric to start with is the cohort retention rate: take the number of athletes still active at the end of a season, divide by the number who started it, and multiply by 100. That one calculation, run annually, gives you a baseline to manage against.
Key reasons retention deserves your attention right now:
- Financial stability: retaining an existing athlete costs far less than recruiting a new one, and longer membership tenure directly increases lifetime revenue per athlete.
- Pathway strength: clubs with stable, multi-year cohorts produce stronger development pipelines and meet governing-body targets more reliably.
- Community continuity: athletes who stay become volunteers, coaches, and advocates; those who leave take their networks with them.
Key takeaways
Athlete retention in sports clubs is best improved by combining cohort measurement, athlete-centred coaching, and flexible membership design, applied consistently across age groups.
| Point | Details |
|---|---|
| Define and measure retention | Calculate your 1-year cohort retention rate each season; track training age annually for deeper insight. |
| Drop-out peaks in adolescence | The SPPM shows roughly 44.7% of participants drop out over three years, with early adolescence the highest-risk window. |
| Coach relationships drive retention | Coaches who accept athlete feedback and build genuine relationships measurably reduce attrition. |
| Flexible tiers recover lapsing athletes | Offering competitive and recreational tracks with easy movement between them retains athletes who would otherwise leave. |
| Start with three low-cost actions | Run a cohort calculation, send an exit survey, and brief coaches on athlete-centred methods this season. |
Table of Contents
- Why clubs should make athlete retention a priority
- Why athletes actually leave: diagnosing the causes in your club
- How to measure retention: the metrics that actually tell you something
- Proven strategies to improve athlete retention
- What the Sport Participation Pathway Model tells you about when to intervene
- A practical 90-day checklist to start improving retention now
- How a gamified development platform can support retention
- A note on where to start
- Sources
Why clubs should make athlete retention a priority
The financial case is straightforward. Recruiting a new member involves marketing spend, trial sessions, kit subsidies, and administrative time. Retaining an existing one costs a fraction of that. Multiply the difference across a squad of 40 athletes and the gap in annual operating cost becomes significant. Beyond the balance sheet, stable squads allow coaches to build on prior-season work rather than starting from scratch each autumn, which improves both coaching ROI and competition performance.
Operationally, high churn disrupts age-group programmes. When a U14 squad loses a third of its players between seasons, the remaining athletes face weaker training environments, reduced match availability, and sometimes the collapse of the age group entirely. That creates a cascade: younger cohorts see fewer role models, and the club’s reputation in the local community weakens.
Strategically, governing bodies across UK sport, from the Football Association to England Netball, tie funding and affiliation criteria to participation numbers. A club that can demonstrate stable or growing retention rates is better positioned for grants, facility access, and coach-education support.
The SPPM evidence reinforces the urgency. Roughly 44.7% of participants dropped out over a three-year window in the study’s dataset, with drop-out varying sharply by age cohort. Focusing solely on recruitment while ignoring that figure is a structural mistake. Sport development literature has long identified motivation, socialisation, and commitment as the core retention levers, and programme design that ignores those levers tends to produce exactly the drop-out rates the SPPM documents.
Why athletes actually leave: diagnosing the causes in your club
Drop-out rarely has a single cause. Most athletes leave because several pressures converge at the same time, which is why a diagnostic approach works better than a single fix.
- Age and life-stage transitions. Adolescence is the highest-risk window. School exam pressure, part-time work, and shifting social priorities all compete with training commitments. The SPPM data shows drop-out varies strongly by age cohort, with early adolescence being a particularly vulnerable point.
- Coaching quality and the coach–athlete relationship. Coaches who accept athlete feedback and build genuine relationships reduce attrition measurably. The reverse is also true: a coach who dismisses athlete input or applies a one-size-fits-all approach is a retention risk the club may not even recognise.
- Rigid commitment models. A single training schedule with no flexibility for school fixtures, family holidays, or part-time jobs pushes athletes out. Many leave not because they want to stop playing, but because the club’s model leaves no room for real life.
- Cost and travel burden. Subscription fees, kit costs, travel to away fixtures, and tournament entry fees accumulate quickly. For families on tighter budgets, these factors parents and families weigh heavily can tip the decision.
- Injury and burnout. Athletes who return from injury to find no adjusted training plan, or who feel overloaded by a year-round competitive calendar, often disengage rather than raise the issue.
- Lack of visible progress. When athletes cannot see their own development, motivation erodes. This is especially acute in the 13–17 age band, where peer comparison is intense.
Pro Tip: Run a short exit survey (five questions, anonymous, sent within two weeks of a lapsed membership) and a brief attendance cohort analysis at the end of each season. Together, these two tools will surface the dominant cause in your specific club far more reliably than any general benchmark.
How to measure retention: the metrics that actually tell you something
Simple renewal rates are a poor proxy for retention health. An athlete who renews but attends twice a month is barely retained; one who trains four times a week and competes regularly is deeply embedded. Cohort retention and training age give clubs far better visibility on the health of their athlete pool than headline membership counts.
Core KPIs to track:
- 1-year retention rate: percentage of athletes from season N still active in season N+1.
- 3-year cohort retention: percentage of a starting cohort still active three years later (the most predictive single figure for programme health).
- Average training age: mean number of years athletes have been with the club; rising training age signals strong retention.
- Session attendance rate: sessions attended divided by sessions available, per athlete per month.
- Churn rate: percentage of athletes who lapse in a given period (the inverse of retention rate).
Worked example: U14 cohort, one-year retention
Measurement cadence: track session attendance monthly; run cohort retention calculations at the end of each season or registration cycle. Review training age annually. These three rhythms together give you both early-warning signals and strategic trend data.
Proven strategies to improve athlete retention
The evidence points to five categories of intervention that consistently move retention rates. None of them require a large budget to start.
Athlete-centred coaching
A grounded-theory study of coaches and young adults identified three social processes that predict whether athletes stay: participation and influence (athletes having a voice in how the club operates), social connectedness (belonging to a group that matters to them), and good conditions (a safe, respectful environment). Clubs that build these three into their coaching culture see stronger retention than those that focus on performance outcomes alone.
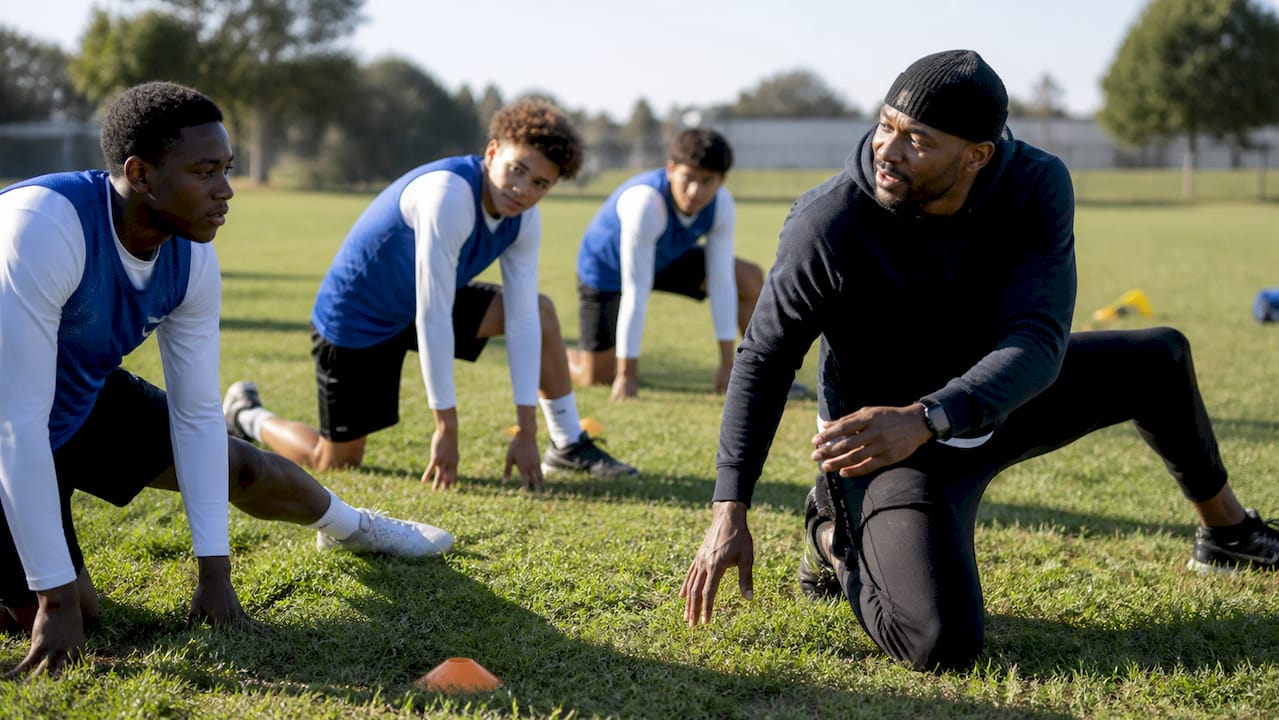
Practical actions: introduce a short athlete feedback form after each training block; hold one athlete-led session per month where players design the warm-up or choose a drill; create a simple athlete advisory group for older age bands.
Flexible commitment tiers
A single competitive track excludes athletes whose availability fluctuates. Effective clubs offer at least two tiers: a competitive pathway for those who want structured progression, and a recreational or development track for those who need lower commitment. Movement between tiers should be easy and stigma-free. This alone can recover athletes who would otherwise lapse entirely.
Social connection
Friendships are a powerful retention mechanism, particularly in the 10–16 age band. Protect friend groups when forming squads. Run two or three club-wide social events per year that are not competition-focused. Pair new members with a peer mentor for their first eight weeks.

Visible progress and development tracking
Athletes who can see their own improvement stay longer. Goal-setting conversations at the start of each season, mid-season check-ins, and end-of-season reviews create a feedback loop that keeps motivation alive. Badges, certificates, and performance milestones give athletes tangible markers of progress.
Coach development and appraisal
Coach–player relationships are a material predictor of whether athletes stay. Investing in coach CPD, particularly training in athlete-centred methods, feedback skills, and safeguarding, is one of the highest-return retention investments a club can make. Annual coach appraisals that include athlete-satisfaction data close the feedback loop at the organisational level.
Pro Tip: Low-cost wins (exit surveys, athlete feedback forms, peer mentoring) can be implemented this season with no budget. Flexible tiers and coach CPD require modest investment but typically pay back within one registration cycle through improved renewal rates.
For data-driven retention strategy examples drawn from collegiate programmes, the DepthChartIQ resource offers useful case framing that translates well to UK club contexts.
What the Sport Participation Pathway Model tells you about when to intervene
The SPPM reframes retention not as a membership renewal problem but as a flow problem across life stages. Participants move in and out of sport through predictable transitions, and the model maps where those flows accelerate into drop-out. That mapping tells you where to concentrate resources.
Key findings from the SPPM:
- Across a three-year window, 50.8% of participants played continuously and 44.7% dropped out, with 4.5% showing discontinuous participation.
- Drop-out is not evenly distributed: it concentrates at specific age transitions, particularly early adolescence and the school-to-work transition.
- Clubs that focus only on recruitment mask high drop-out and miss the opportunity to improve their long-term athlete pool.
Cohort-specific intervention map:
- U8–U12: Focus on fun, family engagement, and friendship. Drop-out at this stage is often driven by parental decisions, so parent education and welcoming club culture matter as much as the coaching itself. Normative sport-development research consistently points to socialisation and motivation as the primary levers here.
- U13–U16: This is the highest-risk window. Autonomy, flexible commitment tiers, and visible progress tracking are the priority interventions. Athletes at this stage need to feel ownership of their development, not just compliance with a coach’s plan.
- U17–adult: Life-stage flexibility becomes critical. Work schedules, university transitions, and relationship commitments all compete. Clubs that offer adult recreational tracks alongside competitive pathways retain far more athletes through this transition.
The SPPM paper is worth reading in full for any club manager building a multi-year retention strategy. Its cohort-flow visualisation alone is a useful tool for board presentations.
A practical 90-day checklist to start improving retention now
This plan is structured by timeline and cost/effort tier. Assign an owner to each task before you start; unowned actions rarely happen.
Days 1–30: quick wins (low cost, high signal)
- Calculate your 1-year cohort retention rate for the last two seasons. Owner: club administrator.
- Design and send a five-question exit survey to all athletes who lapsed in the past 12 months. Owner: club secretary or welfare officer.
- Audit your current commitment model: does the club offer more than one participation tier? Owner: head coach.
- Brief all coaches on the three SPPM social processes (participation/influence, social connectedness, good conditions). Owner: club development officer.
Days 31–60: structural pilots (medium cost)
- Launch a peer-mentoring scheme for new members: pair each new joiner with an established athlete for eight weeks. Owner: age-group lead coaches.
- Introduce a simple athlete feedback form at the end of each training block. Owner: head coach.
- Identify two or three athletes per age group who could form an informal athlete advisory group. Owner: club chair or development officer.
Days 61–90: medium-term foundations (medium to high investment)
- Design a flexible two-tier membership structure (competitive and recreational) with clear, stigma-free movement rules. Owner: club committee.
- Book at least one coach CPD session focused on athlete-centred methods or feedback skills. Owner: head coach or coaching coordinator.
- Set up a basic tracking spreadsheet (or platform) to monitor session attendance and training age by cohort. Owner: club administrator.
Longer-term priorities (beyond 90 days):
- Annual coach appraisal process incorporating athlete-satisfaction data (medium effort, high return).
- Membership design review to reduce hidden cost barriers, including kit subsidies or payment plans (medium cost).
- Technology for progress tracking and visible development milestones (medium to high investment, depending on platform).
How a gamified development platform can support retention
Platform features map directly to the three retention mechanisms the grounded-theory evidence identifies: autonomy, competence, and relatedness. The table below shows how specific Levelup360hq features connect to those mechanisms and the KPIs they influence.
| Platform feature | Retention mechanism | KPI to track |
|---|---|---|
| Live player cards and real-time ratings | Competence: athletes see measurable progress | Average training age; 1-year retention rate |
| XP challenges and badge systems | Autonomy: athletes set and pursue their own goals | Session attendance rate |
| Leaderboards and social feed | Relatedness: peer connection and belonging | 3-year cohort retention |
| Video assessments and coach feedback | Competence + coach–athlete relationship | Churn rate; athlete satisfaction score |
| Session and syllabus management | Good conditions: structured, consistent environment | Attendance rate; coach appraisal scores |
Three-month pilot plan for clubs:
- Month 1: Onboard one age group (suggested: U14 or U15, the highest drop-out risk cohort). Set baseline cohort retention rate and session attendance. Introduce live player cards and the badge system. Measure athlete engagement with the platform weekly.
- Month 2: Activate XP challenges tied to the club’s existing development goals. Run one coach feedback session using the video assessment tool. Survey athletes on whether they feel their progress is visible.
- Month 3: Review attendance and engagement data against baseline. Hold a short athlete advisory session to gather qualitative feedback. Decide whether to extend the pilot to additional age groups based on the data.
Clubs interested in seeing the platform’s features in practice can explore the Levelup360hq demo before committing to a full rollout.
Note: outcomes vary by club size, age group, and implementation quality. This is an illustrative example based on the platform’s feature set and the retention mechanisms identified in the research cited throughout this article. Author credentials and case study data will be added to this section as they become available.
A note on where to start
The research on athlete retention is clear on one thing: clubs that wait for a perfect strategy before acting tend to lose athletes they could have kept. The grounded-theory evidence, the SPPM data, and the coach–player relationship research all point in the same direction. Small, consistent changes to how athletes are heard, how progress is made visible, and how coaches are developed produce measurable results over one to two seasons. You do not need to redesign your entire membership structure in one go. Run the cohort calculation, send the exit survey, and brief your coaches on athlete-centred methods. Those three steps, done this month, will tell you more about your club’s retention health than any external benchmark. Then iterate from what you find.
Sources
The following sources were used in preparing this article and are worth reading in full for club managers building a retention strategy.
- “The individual at the centre” – a grounded theory explaining how sport clubs retain young adults
- The Sport Participation Pathway Model (SPPM): a conceptual model for participation and retention in community club-based sport
- The effect of player–coach relationships on athlete retention (2026)
- The Athlete Retention Playbook: How Clubs Keep Players Engaged Past Age 14 | SafePlay+
- Retention and training age - by Bill Price
Recommended
Turn potential into a player card.
LevelUp360 tracks every match, builds your child's player card, and shows their development over time.
Get started free