Track club-wide performance analytics: a practical guide for UK clubs
Published 21 July 2026
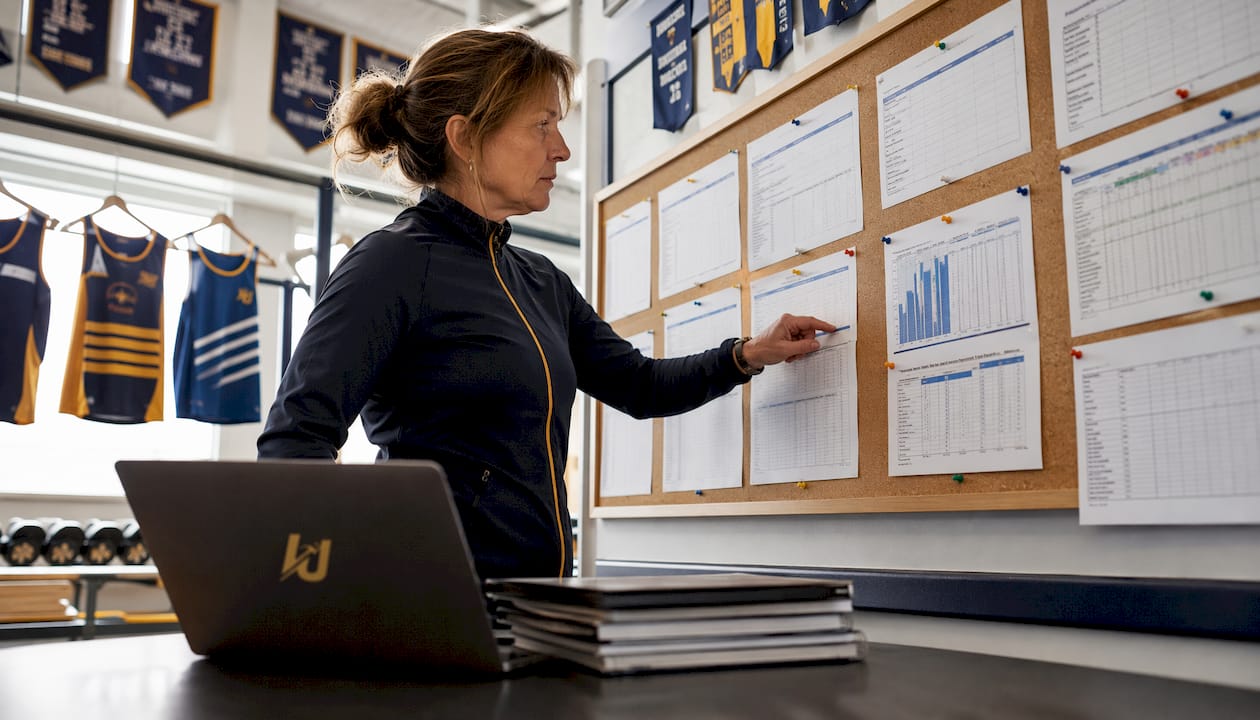
Track club-wide performance analytics gives coaches, managers, and analysts a single, joined-up picture of every athlete in the club, not just the ones on the podium. Done well, it connects GPS load data, video biomechanics, and psychological indicators into one system that tells you where training is working, where injury risk is climbing, and which athletes are quietly plateauing. The clubs that get this right stop guessing and start making decisions grounded in evidence.
The core elements span four domains: technical (running form, stride mechanics), physical (speed, workload, acute-to-chronic workload ratio), tactical (race strategy, competition pacing), and psychological (motivation, focus under pressure). Pulling all four together is what separates a genuine club analytics programme from a collection of spreadsheets.
Key outcomes clubs typically target include:
- Automated calculation of load metrics such as ACWR, sprint distance, and max speed
- Real-time injury risk flags across the full athlete roster
- Benchmarking of squads and age groups against historical club data
- Longitudinal tracking of individual development across seasons
- Role-based dashboards so coaches see the full picture and athletes see their own
How do UK track clubs collect and analyse performance data?
Data collection in a track club usually starts at training sessions and competitions, where GPS devices, wearable sensors, and video cameras capture raw output. Coaches or analysts upload files, often in CSV or Excel format, to a central platform that processes the numbers automatically. Analytics platforms can automate calculation of over 40 metrics, including ACWR, z-scores, weekly load, high-speed running, and sprint distance, removing the need for manual spreadsheet work entirely.
The typical data flow looks like this:
- GPS devices record position, speed, and acceleration during sessions
- Naos sensors capture movement patterns and muscular load in real time
- Video analysis software records technique for biomechanical review
- Wearables and heart rate monitors feed recovery and fatigue data
- Manual athlete logs (via mobile app) add subjective wellness scores
Once uploaded, the platform aggregates data across all athletes, flags anomalies, and surfaces trends for the coaching team. The analyst’s job shifts from data entry to interpretation, which is where the real value sits.
Coaches and analysts work best when they review dashboards together before each training block, using the data to adjust session intensity rather than waiting for a post-competition debrief.
What are the key components of effective performance analysis?
Four analytical pillars underpin a well-run club programme, and neglecting any one of them leaves gaps that show up in competition.
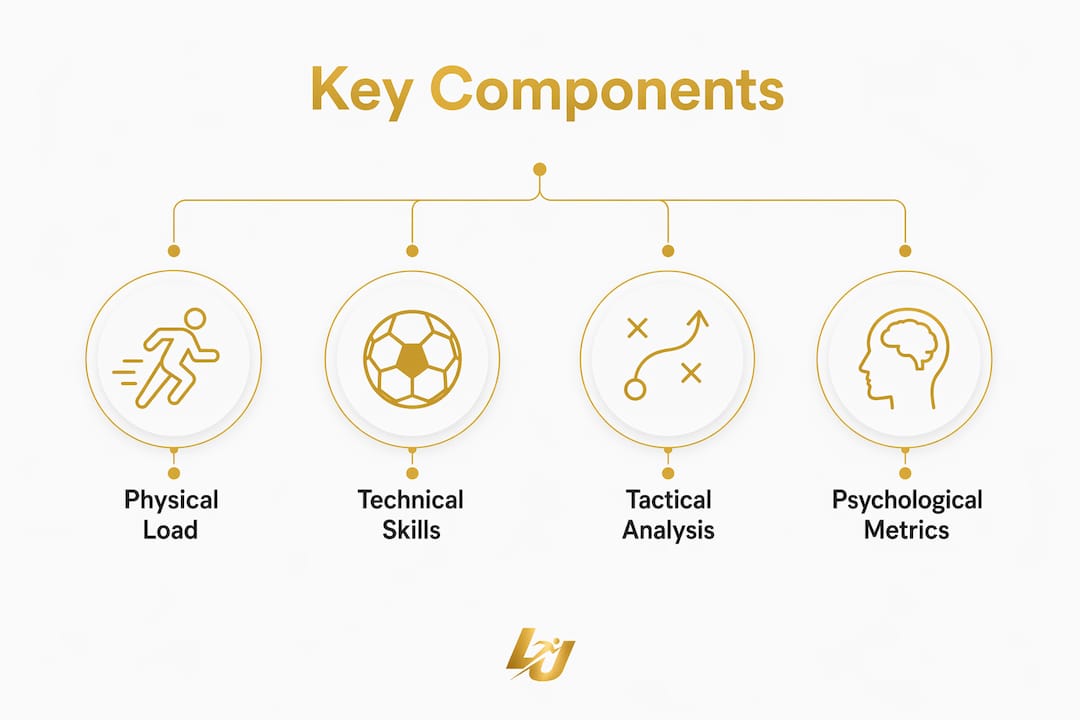
Technical analysis examines running form, stride frequency, ground contact time, and biomechanical efficiency. Video analysis software makes this accessible even at club level, allowing frame-by-frame review of an athlete’s mechanics across different phases of a race.
Physical analysis is the most data-rich pillar. Key performance indicators here include:
- Weekly training load and ACWR
- High-speed running distance per session
- Sprint count and peak velocity
- Heart rate recovery curves
- Session RPE (rate of perceived exertion)
Tactical analysis covers race strategy, split times, and competitive pacing decisions. Comparing an athlete’s competition splits against their training benchmarks often reveals whether a tactical plan is being executed or abandoned under pressure.
Psychological indicators are the hardest to quantify but worth tracking. Motivation scores, sleep quality logs, and readiness ratings collected via short daily check-ins give coaches early warning of mental fatigue before it becomes a physical problem. Collaborative platforms that allow coach and analyst cooperation improve the accuracy of these insights and make sure they feed back into training programmes rather than sitting in a folder nobody opens.
Which tools do UK track clubs use for athletic performance tracking?
GPS tracking devices are the most widely adopted technology in UK club athletics. They record position and velocity data at high frequency, and most modern units are light enough for sprinters and field athletes to wear without affecting performance. Platforms compatible with GPS exports display high-speed running, sprint distance, accelerations, and max speed in dashboards built for coaching teams rather than data scientists.
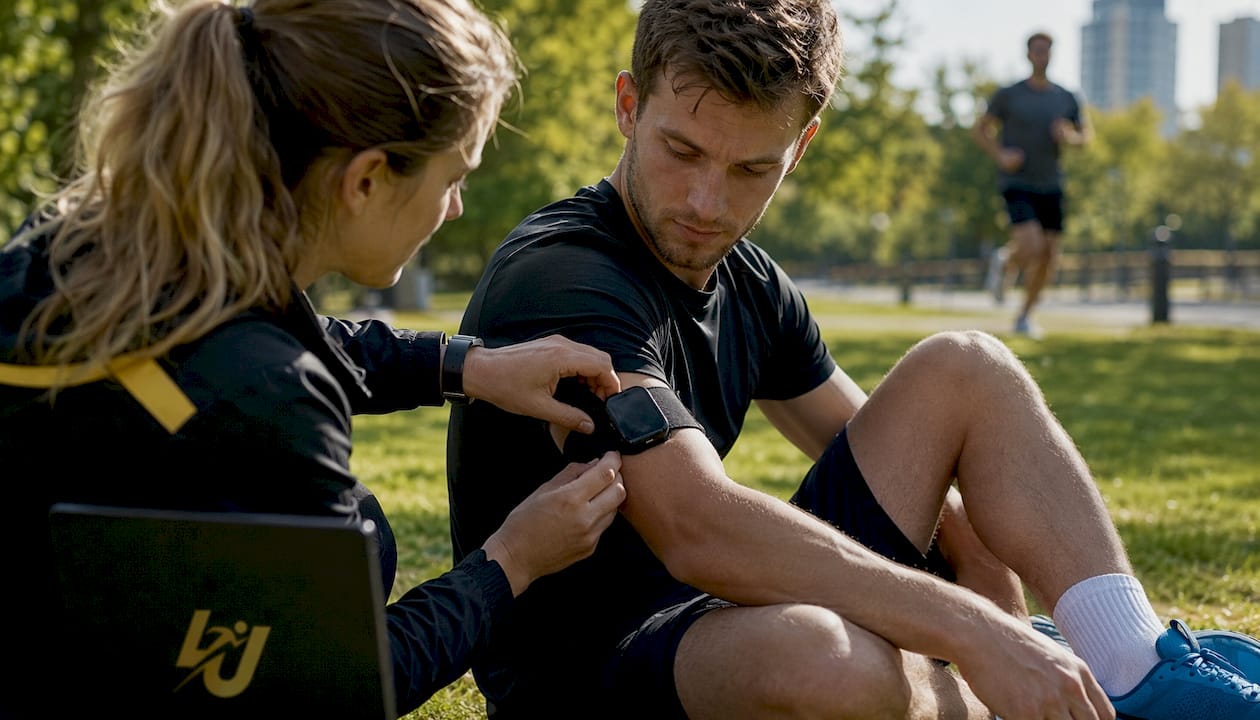
The Naos sensor system goes a step further by capturing detailed movement and muscular load data, giving analysts a picture of how an athlete’s body is responding to training stress at a granular level. This is particularly useful for monitoring accumulation of fatigue across a full squad over a training block.
Video analysis software sits alongside GPS data as the standard tool for biomechanical and tactical review. Video analytics integration is key for comprehensive performance assessment, allowing coaches to overlay technique footage with speed and force data for a complete picture of what is happening mechanically.
Key features to look for across any tool set:
- Unlimited athlete profiles with individual load histories
- Automated injury risk monitoring and threshold alerts
- CSV and Excel import compatibility for legacy data
- Real-time dashboards accessible on mobile devices
- Role-based access so athletes see personal data only
Six universal KPIs established by industry bodies provide a common language for tracking both athlete and club health, connecting operational decisions to performance outcomes across the organisation.
How do you build a sustainable club-wide analytics system?
The most common reason analytics programmes fail at club level is not the technology. It is the admin burden placed on coaches who already have full session schedules. Sustainable data collection requires systems designed for non-analysts, with easy input methods such as mobile athlete logging and automated syncing from wearables, to maintain high compliance and avoid pilot programme collapse.
Best practices for long-term sustainability:
- Assign a dedicated data lead (analyst or senior coach) to own the system
- Use automated wearable syncing wherever possible to cut manual entry
- Set a minimum viable data set: three to five metrics per athlete per session
- Review dashboards weekly as a coaching team, not monthly as a report
- Build athlete buy-in by sharing personal progress data with each athlete regularly
Role-based data access is one of the most overlooked design decisions. Coaches need full roster visibility; athletes need to see their own data without being overwhelmed by squad comparisons. Getting this right reduces both data overload and privacy concerns, and it accelerates adoption across the club.
Data-driven decisions enhance club management effectiveness by allowing leadership to benchmark squads, monitor athlete health, and justify resource allocation with evidence rather than instinct.
Pro Tip: Start with one metric category, physical load, and get compliance above 80% before adding technical or psychological data layers. Clubs that try to collect everything at once typically end up with incomplete data across all categories.
Ethical and privacy compliance when handling athlete data is a legal obligation under UK GDPR, not a nice extra. Clear data access policies, written consent from athletes (and parents for under-18s), and secure cloud storage are the minimum standard for any UK club.
How do you track athlete development across multiple seasons?
Longitudinal data allows clubs to analyse athlete development over seasons, using trend analysis and squad benchmarking to support strategic training adaptation. The practical approach is to establish a baseline for each athlete at the start of every season, then compare against the same period in prior years rather than just the previous week.
Useful methods include:
- Season-on-season load comparisons to identify whether training volume is progressing appropriately
- Personal best progression charts mapped against training load history
- Injury occurrence logs correlated with workload spikes to identify recurring risk patterns
- Squad percentile rankings updated quarterly so coaches can see where each athlete sits relative to peers
The key discipline is consistency: collecting the same metrics in the same way each season so that year-three data is genuinely comparable to year-one data.
How should you present performance data to coaches and athletes?
Data that coaches cannot read quickly does not get used. The most effective visualisations are simple: a traffic-light system for load status, a line chart for personal best progression, and a weekly summary card per athlete that fits on a phone screen.

For athletes, the framing matters as much as the format. Showing an athlete their ACWR trend alongside their competition results makes the connection between training discipline and race performance concrete and personal. Avoid presenting squad comparisons to athletes without context; raw ranking tables without explanation tend to demoralise rather than motivate.
Coaches benefit most from aggregated views: squad load heatmaps, injury risk flags sorted by urgency, and group trend lines that highlight which training cohort is responding well. Weekly team meetings work best when the dashboard is on screen and the conversation is about decisions, not about explaining what the numbers mean.
What can UK track clubs learn from analytics success stories?
UK-based performance programmes that have adopted systematic athletic performance tracking consistently report the same pattern: the first season is about building data habits, and the measurable gains come in season two and three when longitudinal comparisons become possible.
Clubs that integrate GPS load monitoring with video analysis report fewer soft-tissue injuries during peak competition periods, because coaches can see workload accumulation before it becomes a problem rather than after. Programmes that share personal progress data directly with athletes, rather than keeping it coach-only, report higher training attendance and stronger athlete engagement with the development process.
The pattern across successful implementations is consistent: technology alone does not produce results. The clubs that see genuine improvement are the ones where a coach and an analyst review the data together every week and act on what they find. Platforms like Levelup360hq are built around exactly this model, combining performance analytics with athlete engagement tools so that data feeds development rather than sitting in a system nobody checks.
Levelup360hq: club-wide analytics built for the whole athlete ecosystem
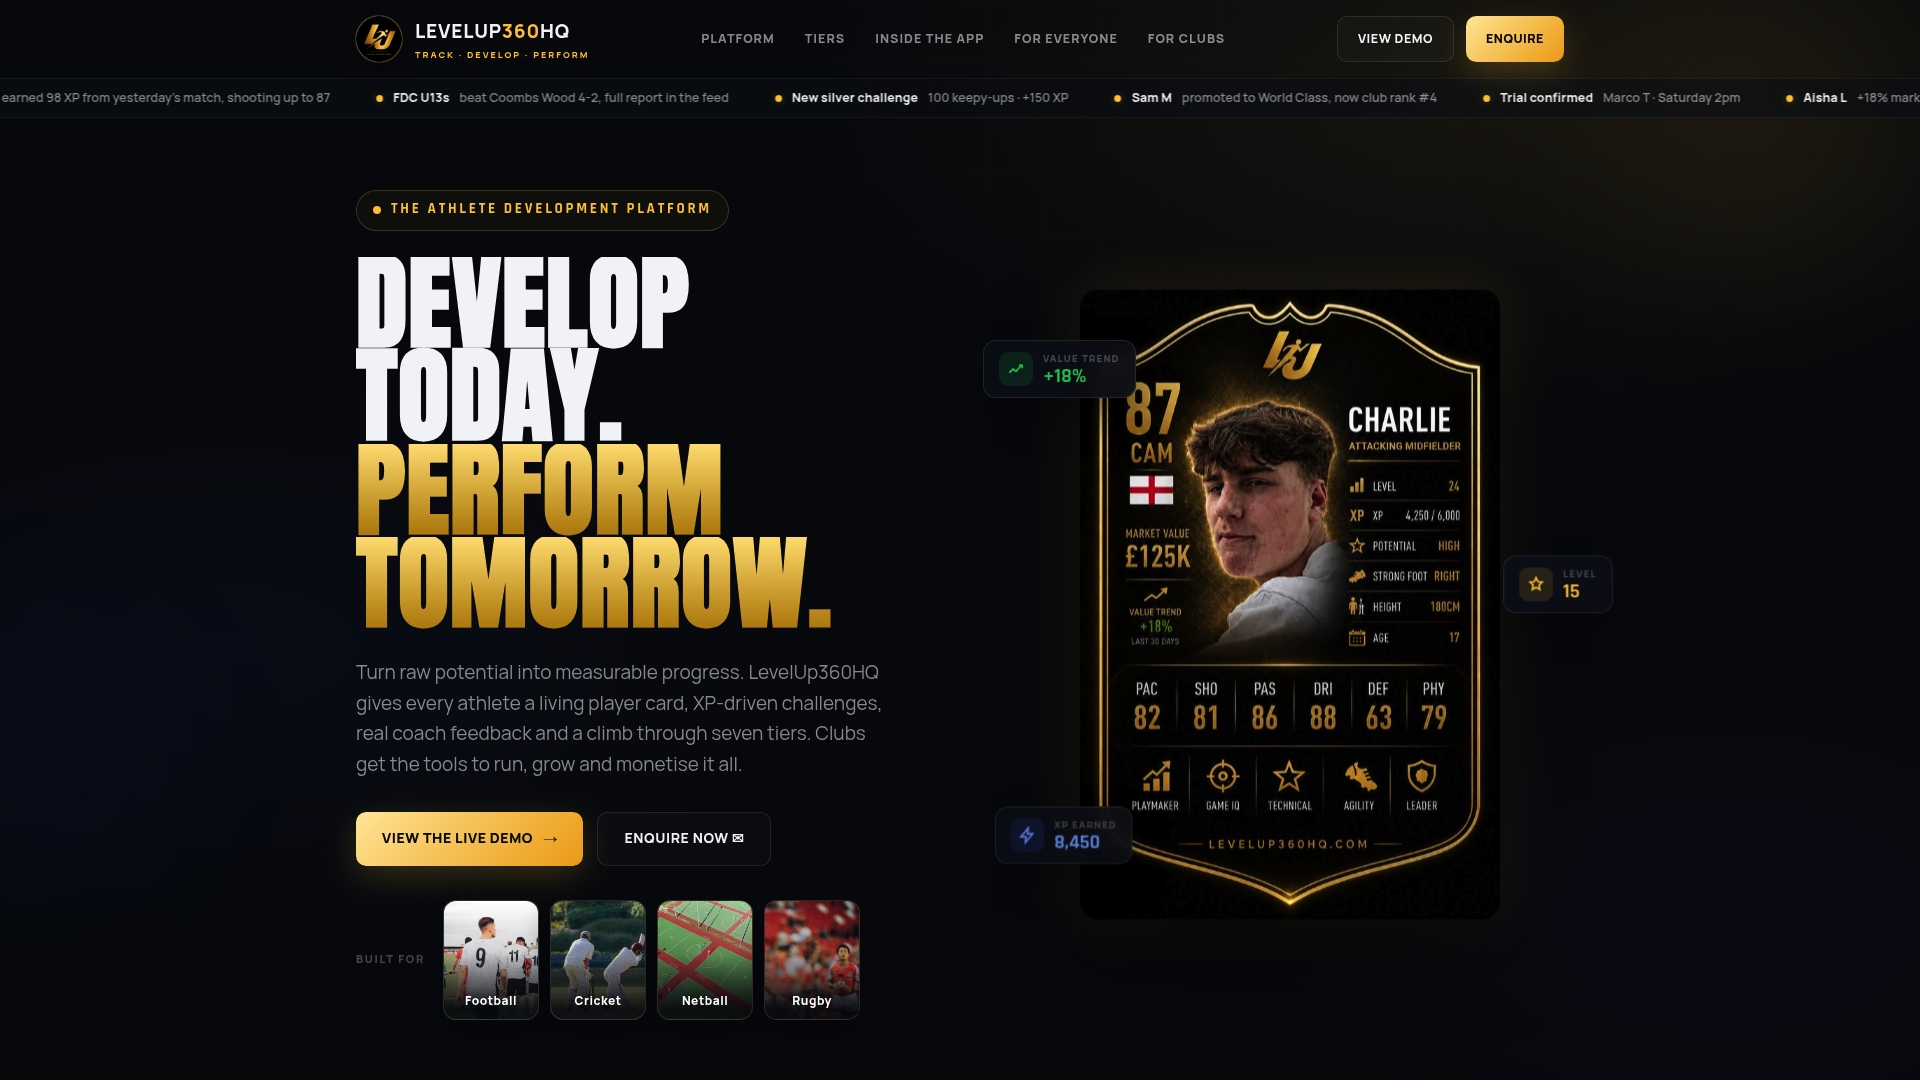
Levelup360hq brings together performance analytics, gamified athlete development, and club management tools in one platform. Coaches get video assessment workflows, session management, and full roster dashboards. Athletes get live performance cards, XP-driven challenges, and personal progress tracking that makes development visible and motivating. Club managers get CRM tools, subscription management, and white-label branding.
Explore the platform or try the demo to see how Levelup360hq handles club-wide performance data from collection through to athlete development.
Key takeaways
Club-wide performance analytics works when it integrates physical, technical, tactical, and psychological data into a single system that coaches and analysts review together every week.
| Point | Details |
|---|---|
| Four analytical pillars | Technical, physical, tactical, and psychological data together give a complete picture of athlete and club performance. |
| Automate data collection | Platforms that sync wearables automatically and accept CSV imports maintain compliance and cut coach admin burden. |
| Role-based access matters | Coaches need full roster visibility; athletes need personal data only, reducing overload and protecting privacy. |
| Longitudinal baselines | Comparing the same metrics season on season reveals development trends that weekly snapshots cannot show. |
| Coach-analyst collaboration | Weekly dashboard reviews where coaches and analysts act on findings together drive measurable performance gains. |
Recommended
Turn potential into a player card.
LevelUp360 tracks every match, builds your child's player card, and shows their development over time.
Get started free