Role of challenge completion in assessing drive
Published 9 July 2026

Challenge completion is the most reliable behavioural marker coaches have for assessing an athlete’s drive. When an athlete consistently finishes meaningful, difficult tasks, they demonstrate motivational persistence under pressure. That persistence is what sports psychologists call achievement motivation, the internal force that separates athletes who grow from those who plateau. The role of challenge completion in assessing drive is not about counting finished reps or ticked boxes. It is about reading what completion patterns reveal: genuine intrinsic motivation, fear-based avoidance, or simple complacency. Platforms like Levelup360hq have built entire development frameworks around this principle.
How does completing challenges reveal genuine drive versus anxiety or complacency?
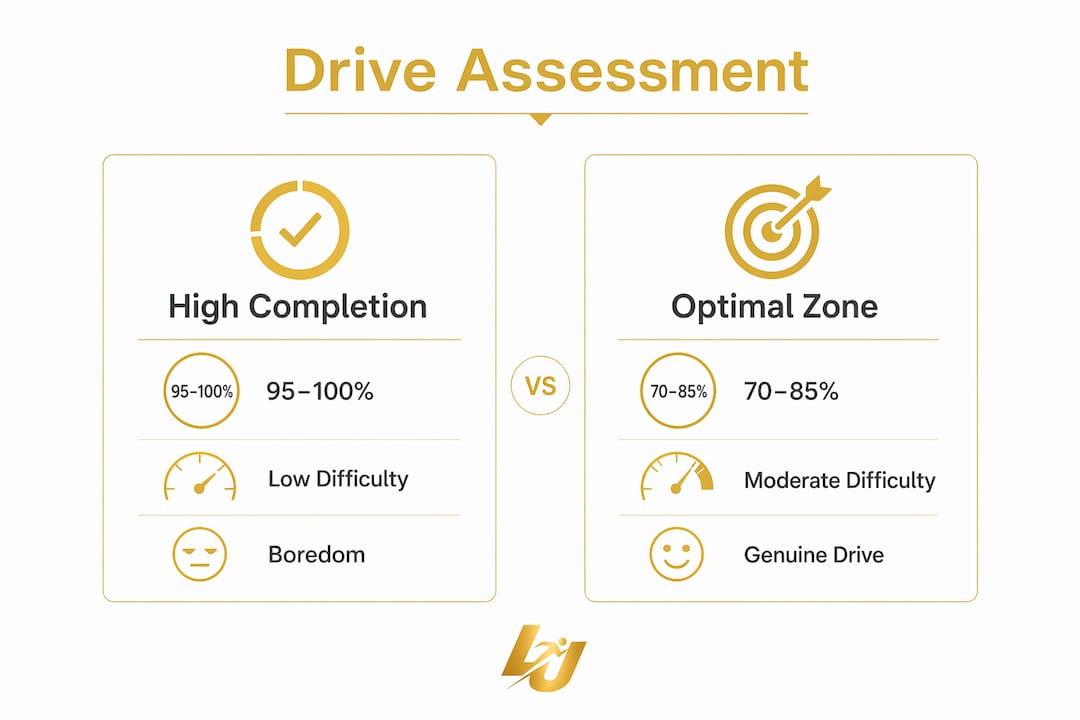
The Goldilocks Rule defines the sweet spot: an athlete performing at roughly 85% success on a given challenge is operating in the zone where drive is most visible. Below 70% completion on genuinely difficult tasks signals anxiety, not lack of ability. At 100% completion, the task is too simple, and the athlete is coasting rather than striving.
This distinction matters enormously for coaches. An athlete who always completes every challenge looks motivated on paper. In reality, consistent perfect completion is a warning sign that the challenge is not calibrated correctly. Drive only shows itself when there is real risk of failure.
Achievement motivation theory adds another layer. Hope for Success (Ms) and Fear of Failure (Maf) are two opposing forces that shape how athletes respond to challenge. High Ms athletes lean into difficulty and maintain effort as stakes rise. High Maf athletes reduce effort when difficulty increases, protecting themselves from the psychological cost of failing. Completion rates alone cannot tell you which force is operating. You need to track completion alongside perceived difficulty and the athlete’s emotional response to failure.
- Completion rate above 85% with low difficulty: Indicates boredom or complacency, not drive.
- Completion rate below 70% with high difficulty: May indicate anxiety or Fear of Failure rather than low drive.
- Completion rate of 70–85% with moderate to high difficulty: Strongest signal of genuine achievement motivation.
- Erratic completion with inconsistent effort: Suggests motivational ambivalence or poor challenge design.
Pro Tip: Track perceived difficulty alongside completion rate every session. An athlete who reports a task as “easy” but only completes 60% of it is giving you a very different signal from one who reports it as “hard” and completes 75%.
What neurobiological mechanisms underpin challenge completion and motivation?

The brain’s reward system does not respond equally to all completed tasks. Dopamine release is significantly higher when effort is required for a reward than when a reward arrives easily. This is not a motivational metaphor. It is a measurable neurochemical fact. Effortful completion triggers a phasic dopamine burst that reinforces the behaviour and builds the desire to repeat it.
The ventromedial prefrontal cortex (vmPFC) acts as the brain’s relevance filter. It tags goals as self-relevant before releasing the completion signal. A challenge that feels meaningless to an athlete, regardless of how hard they work, will not generate the same dopamine response. Tasks lacking meaningful completion signals produce what neuroscientists call “energised dissatisfaction.” The athlete feels busy but not fulfilled, which erodes motivation over time.
The critical distinction is between productivity and accomplishment. An athlete can complete a high volume of work and still experience declining drive if none of that work carries a meaningful completion signal. The brain rewards closure on goals it considers self-relevant, not raw output.
This is why coaches who measure drive purely through volume metrics get it wrong. An athlete grinding through 200 repetitions of a drill they find pointless is not demonstrating drive. They are demonstrating compliance. The neurobiological signal that indicates real motivation is the phasic dopamine burst that follows effortful, meaningful completion.
The sunk cost fallacy creates a specific trap in drive assessment. Athletes can persist in ineffective efforts because they have already invested heavily, not because they are genuinely motivated. High effort sustained without real progress or completion signals masks the absence of drive rather than confirming its presence.
Pro Tip: Ask athletes to rate how meaningful each completed challenge felt on a scale of 1 to 5. Low meaningfulness scores on completed tasks are an early warning sign of motivational stagnation, even when completion rates look healthy.
How to measure and calibrate challenge completion to assess drive
Behavioural observation alone is insufficient for accurate drive assessment. Brief self-report tools measuring goal focus, persistence, and internal motivation take 4–6 minutes and contain 20–30 items. They complement completion data by revealing whether an athlete’s motivation is intrinsic or driven by fear of failure. Used together, behavioural and self-report data give coaches a far more accurate picture.
McClelland’s research on achievement motivation established a clear calibration principle. Individuals motivated by achievement prefer challenges where success probability sits between 50% and 70%. Outside that range, motivation drops. Below 50%, the task feels impossible. Above 70%, it feels trivial. The “ring-toss” pattern McClelland observed, where high achievers consistently choose moderate distances rather than easy or impossible ones, predicts optimal challenge difficulty with remarkable accuracy.
| Completion rate | Difficulty level | Drive state indicated |
|---|---|---|
| 95–100% | Low | Boredom or complacency |
| 85–95% | Moderate | Comfortable but not stretched |
| 70–85% | Moderate to high | Optimal drive zone |
| 50–70% | High | High achievement motivation |
| Below 50% | Very high | Anxiety or task mismatch |
Coaches using this table should treat it as a diagnostic tool, not a rigid rulebook. An athlete sitting at 55% completion on a genuinely difficult task is not failing. They are demonstrating exactly the kind of motivated persistence that McClelland identified as the hallmark of high achievers.
Best practices for monitoring challenge levels include:
- Review completion rates weekly, not just at the end of a training block.
- Adjust challenge difficulty when an athlete sustains above 90% completion for three consecutive sessions.
- Use athlete self-reports to confirm whether difficulty perception matches objective task design.
- Separate completion data by challenge type to identify motivation patterns across different skill areas.
- Record persistence behaviours, such as reattempting failed challenges, as a secondary drive indicator.
Pro Tip: Avoid rewarding volume over meaningful completion. An athlete who completes 10 well-calibrated challenges with full effort shows more drive than one who rushes through 30 easy ones. Chasing output numbers without adjusting difficulty is the fastest route to burnout.
What assessment pitfalls should coaches avoid when reading completion data?
The most common error in drive assessment is conflating high effort with high drive. Effort is an input. Drive is the motivational force that sustains effort toward meaningful goals. An athlete who works extremely hard on tasks that never challenge them is not demonstrating drive. They are demonstrating work ethic, which is valuable but distinct.
Gamification without proper challenge calibration creates a specific problem. Artificial reward systems exploit dopamine temporarily but do not sustain true motivation. When athletes collect badges or points for trivial completions, the reward circuit habituates quickly. The initial spike in engagement fades, and what remains is a hollow routine rather than genuine drive. Levelup360hq addresses this directly by tying XP rewards to calibrated challenge difficulty rather than simple task volume.
Common pitfalls coaches should actively avoid:
- Treating completion rate as the only metric. Completion without difficulty context is meaningless. Always pair completion data with task difficulty ratings.
- Ignoring the self-relevance of challenges. Athletes who do not connect a challenge to their personal goals will not generate the neurobiological completion signal that indicates real motivation.
- Rewarding persistence in the wrong direction. An athlete who keeps repeating a failed approach without adjustment is exhibiting sunk cost behaviour, not drive. Genuine drive includes the capacity to adapt.
- Failing to adjust challenge difficulty over time. Motivational stagnation sets in when tasks remain static. Drive assessment requires a moving target.
- Confusing compliance with motivation. Athletes in high-pressure environments often complete tasks to satisfy coaches rather than themselves. Self-report tools help distinguish the two.
Energised dissatisfaction is the subtlest pitfall of all. An athlete can appear highly motivated, completing tasks, attending sessions, and reporting high effort, while their actual drive is declining. The signal is in the meaningfulness ratings and the dopamine completion response, not the surface-level output.
Key takeaways
Challenge completion reveals genuine drive only when paired with difficulty calibration, self-relevance checks, and both behavioural and self-report data.
| Point | Details |
|---|---|
| Optimal completion zone | A 70–85% completion rate on moderately difficult tasks is the strongest signal of genuine drive. |
| Neurobiological signal | Effortful, meaningful completion triggers phasic dopamine bursts that reinforce motivation and build persistence. |
| Self-report tools | 4–6 minute assessments with 20–30 items complement behavioural data and reveal intrinsic versus fear-based motivation. |
| McClelland’s calibration | High achievers prefer 50–70% success probability; outside this range, motivation drops due to boredom or anxiety. |
| Pitfall to avoid | High effort without a meaningful completion signal indicates sunk cost behaviour, not genuine drive. |
Why I stopped trusting completion rates alone
Early in my coaching work, I made the same mistake most coaches make. I watched athletes finish sessions, tick off challenges, and assumed the completion rate told me everything I needed to know about their drive. It did not. The athletes who completed everything were often the ones running on autopilot. The ones who struggled, failed, and came back the next day were the ones with real fire.
What changed my thinking was paying attention to what happened after failure. Athletes with genuine drive do not collapse when they miss a target. They recalibrate. They ask questions. They come back with a slightly different approach. That behaviour is far more revealing than any completion percentage.
The neuroscience backs this up. The vmPFC completion signal only fires when the goal feels personally meaningful. Coaches who design challenges without consulting the athlete about relevance are essentially measuring compliance, not drive. The fix is straightforward: involve athletes in setting the challenge parameters. When they have ownership, the completion signal is real.
Platforms like Levelup360hq have made this easier by building self-relevance into the challenge architecture. Athletes set targets, track their own progress, and see their development reflected in real-time ratings. That feedback loop is what turns challenge completion into a genuine measure of drive rather than a box-ticking exercise.
— Chris
How Levelup360hq tracks drive through challenge completion

Levelup360hq is built around the principle that challenge completion only matters when the challenge is correctly calibrated. The platform’s XP-driven challenge system ties rewards to difficulty, not volume, so coaches get accurate drive data rather than inflated completion numbers. Athletes see their real-time ratings shift in response to meaningful completions, which reinforces the neurobiological reward loop that sustains motivation.
Coaches benefit from session management tools, video assessments, and approval workflows that make it straightforward to adjust challenge difficulty as athletes develop. The interactive demo shows exactly how challenge calibration and drive tracking work in practice, giving coaches a clear picture of how to apply these principles across football, cricket, netball, rugby, and beyond.
FAQ
What is the role of challenge completion in assessing drive?
Challenge completion is a behavioural marker of achievement motivation. It reveals genuine drive when completion rates sit between 70% and 85% on appropriately difficult tasks, distinguishing motivated persistence from anxiety or complacency.
What completion rate signals optimal drive in athletes?
An 85% success rate on a moderately difficult challenge indicates the optimal drive zone. Below 70% on hard tasks suggests anxiety, while 100% completion on easy tasks signals boredom rather than motivation.
How does neuroscience explain the link between challenge completion and motivation?
The brain releases higher phasic dopamine bursts when effort is required for a reward. The vmPFC tags goals as self-relevant before triggering this completion signal, meaning meaningless completions do not reinforce drive.
What is the difference between drive and effort in sports performance?
Drive is the motivational force that directs and sustains effort toward meaningful goals. High effort without a meaningful completion signal, often caused by the sunk cost fallacy, does not confirm drive and can mask its absence.
How can coaches use self-report tools alongside completion data?
Brief self-report assessments taking 4–6 minutes with 20–30 items measure goal focus, persistence, and intrinsic motivation. Combined with completion rate and difficulty data, they give coaches a complete picture of an athlete’s drive.
Recommended
Turn potential into a player card.
LevelUp360 tracks every match, builds your child's player card, and shows their development over time.
Get started free