How to rate player performance digitally in football
Published 23 July 2026

The most effective way to rate player performance digitally is to grade every on-pitch action relative to what was expected of the player in that specific role, position, and game situation. Not just whether a pass was completed, but whether it was the right pass, executed well, under pressure, against a high-pressing opponent. That shift from raw counting to contextual grading is what separates modern digital assessment from a traditional match report.
Digital player rating systems use AI and event-based data to assign scores to individual actions throughout a match. The most widely referenced scale runs from –2 to +2 per event, where 0 represents a player meeting the expected standard for their role. Those raw event scores are then converted to a standardized composite score, facilitating comparison across positions and leagues. Platforms like Gradient Player Grades and Levelup360hq have built their systems around this logic, and both are accessible to UK coaches and analysts working at amateur and professional levels.
Key features of a well-built digital rating system:
- Grades every action, not just goals, assists, or tackles
- Adjusts scores for role, position, and situational context
- Converts event scores to a standardised 0–100 scale
- Reduces subjectivity through AI-driven, multi-reviewer processes
- Applies equally to professional scouting and grassroots development
How are digital player ratings actually calculated?
The calculation starts the moment a player touches the ball or makes a defensive movement. Each event is captured and graded on a –2 to +2 scale, with 0 as the baseline for expected performance. A well-weighted through ball under pressure might earn a positive score; a poorly timed tackle in a low-risk zone might receive a negative score.

Raw event grades are not the final word. AI-powered video analysis then adjusts those scores using contextual models that account for over 135 data points per play, including game state, opposition quality, and pitch zone. That adjustment is what stops a routine clearance in an easy win from being weighted the same as the same clearance in a tense defeat.
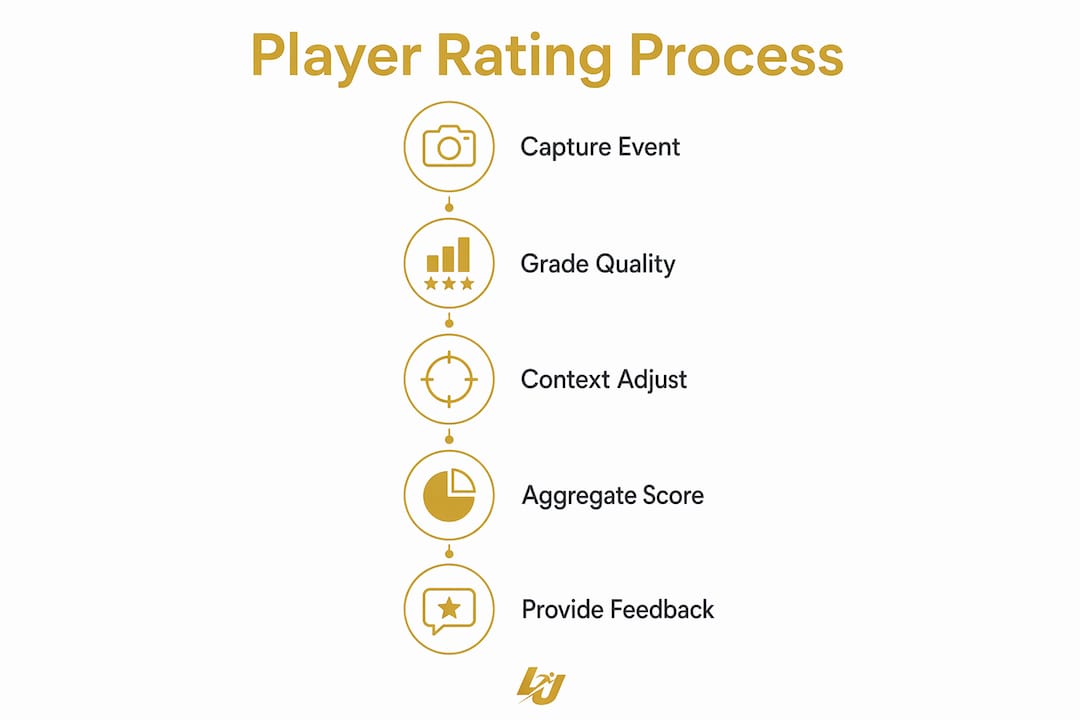
Calculation steps from event capture to final rating:
- A stat keeper or automated system records every player action in real time, synchronised to the match clock
- Each action is assigned a raw grade from –2 to +2 relative to expected performance
- Contextual models adjust the raw grade for pressure, opposition level, and game state
- Adjusted grades are aggregated across all events in the match
- The aggregate is converted to a 0–100 score for easy comparison across positions and leagues
| Event Type | Raw Grade Range | Context Adjustment Example |
|---|---|---|
| Successful through ball under pressure | +1 to +2 | Boosted if played in opponent’s high-press |
| Routine completed pass | 0 | Reduced if against low-block opposition |
| Poor through ball, opponent miscontrols | –1 to –2 | No credit for lucky outcome |
| Tackle in low-risk zone | –0.5 to 0 | Penalised if out of position |
| Interception in high-pressure zone | +1 to +2 | Rated higher in tight areas |
Grading on quality rather than outcome is the principle that makes this approach reliable. A midfielder who plays a poor through ball that an opponent miscontrols still earns a negative grade, because the decision and execution were poor regardless of what happened next.
What metrics do digital rating systems actually measure?
No single metric tells the full story of a player’s contribution. Digital rating systems pull from four broad categories, weighting each according to the player’s role.

Attacking metrics cover goals, assists, expected goals (xG), shot accuracy, and successful dribbles. xG is particularly useful because it accounts for shot quality rather than just volume, so a striker who consistently finds high-probability positions scores well even in a goalless run.
Passing metrics include completion rate, key passes, progressive passes, and passes into the final third. Progressive passes, those that move the ball at least ten metres closer to the opponent’s goal, are a better indicator of a midfielder’s influence than raw completion percentage alone.
Defensive metrics are where context matters most. Tackles, interceptions, and aerial duels won are the standard inputs, but PPDA (passes allowed per defensive action) adds a layer that raw tackle counts cannot. PPDA measures how many passes an opponent completes before a defensive team intervenes, calculated only during the opposition’s attacking phase. A low PPDA signals an aggressive, well-organised press.
Discipline metrics round out the picture: fouls committed, yellow and red cards, and the timing of those offences relative to game state. A foul that concedes a free kick in a dangerous position in the 89th minute carries more weight than the same foul in the 20th minute of a comfortable lead.
Metric categories at a glance:
- Attacking: goals, assists, xG, dribbles, shots on target
- Passing: accuracy, key passes, progressive passes, final-third entries
- Defending: tackles, interceptions, duels won, PPDA
- Discipline: fouls, cards, timing of offences relative to game state
Which digital tools can UK coaches use to rate players?
Gradient Player Grades
Gradient Player Grades grades every player on every event during a match, using a team of analysts working to a strict grading guide. The system was built with Premier League clubs to reflect the demands of elite football, with input from performance analysts, coaches, and recruitment leads. Scores are assigned per event using a standardized scale, then converted to a composite score at match and season level, enabling comparison across leagues. The system accounts for over 135 data fields per play, which is what allows it to distinguish a good defensive action from a lucky one.
Levelup360hq
Levelup360hq takes a different angle. Where Gradient is built primarily for professional analysis, Levelup360hq is designed for the full athlete ecosystem: players, coaches, and clubs at every level. The platform generates FIFA-style live player cards with real-time ratings, XP-driven challenges, and tier progression, turning performance data into something athletes actually want to engage with. Coaches get video assessment tools, approval workflows, and session management alongside the analytics, so the rating process connects directly to training and development planning. For UK academies and grassroots clubs, the white-label branding and CRM features mean the platform can sit inside an existing club structure rather than alongside it.
Key features across both tools:
- Role-aware grading that adjusts for position and game context
- Video analysis integration for frame-by-frame review
- Standardised scoring scales for cross-competition comparison
- Real-time data capture and live rating updates
- Accessible to both professional clubs and amateur academies in the UK
Pro Tip: Use Levelup360hq’s demo environment to test how live player cards and video assessments work before rolling the platform out to your squad. Seeing the rating update in real time after a video review session changes how players relate to their own data.
AI-driven tools in adjacent sports have followed a similar path. Platforms applying AI to athlete performance analysis across rowing and other disciplines show how the same contextual grading logic transfers beyond football, which is useful context for multi-sport academies using Levelup360hq across cricket, netball, and rugby.
Benefits, limitations, and how to get the most from digital ratings
Digital ratings give coaches something traditional observation rarely can: a consistent, role-aware record of every player’s contribution across an entire season. Role-specific expectations built into the grading model mean a holding midfielder is not penalised for low xG, and a centre-back is not rewarded simply for avoiding goals when the goalkeeper made three crucial saves.
The benchmarking value is real for development too. Comparing a 16-year-old’s rating trajectory across six months of academy football gives a development coach far more to work with than end-of-season impressions.
That said, digital ratings carry genuine limitations worth understanding before you rely on them.
Benefits:
- Objective, consistent evaluation across positions and competition levels
- Role-aware scoring reduces bias from traditional stats
- Performance benchmarking supports player development planning
- Tracks progress over time with a standardised scale
Limitations and risks:
- Data privacy and consent frameworks must be in place before collecting athlete data, particularly for under-18s
- Over-reliance on ratings can miss tactical nuance that only a coach’s eye catches
- Metrics need tailoring to your team’s specific system; a high-press side will value PPDA differently than a low-block team
- Ratings at grassroots level may lack the sample size to be statistically reliable early in a season
Pro Tip: Combine digital ratings with video and your own match observations rather than treating the score as the final verdict. A player rated 62 who consistently makes the right run off the ball in your specific system may be more valuable than a 74 who does not.
Benchmarking also needs to account for competition level and age group. A 78-rated performance in an under-15 regional league is not directly comparable to the same score in senior non-league football. Build separate reference ranges for each context your squad operates in, and revisit them at the start of each season.
Key takeaways
Digital player rating systems grade every on-pitch action relative to role and situational context, converting event scores to a 0–100 scale for consistent, objective comparison across positions and competition levels.
| Point | Details |
|---|---|
| Grade quality, not just outcome | Systems like Gradient Player Grades penalise poor decisions even when the result is lucky, improving rating reliability. |
| Context adjusts every score | Over 135 data points per play account for pressure, opposition level, and game state before a final grade is set. |
| Role-aware metrics prevent bias | Holding midfielders and centre-backs are assessed against position-specific expectations, not generic output targets. |
| Combine ratings with video review | Hybrid analysis using tools like Levelup360hq overcomes the contextual gaps that fully automated ratings can miss. |
| Privacy and consent come first | Transparent data practices and consent frameworks are required before collecting and using athlete performance data. |
Recommended
Turn potential into a player card.
LevelUp360 tracks every match, builds your child's player card, and shows their development over time.
Get started free