Performance analytics tools for coaches: choose and implement
Published 8 August 2026
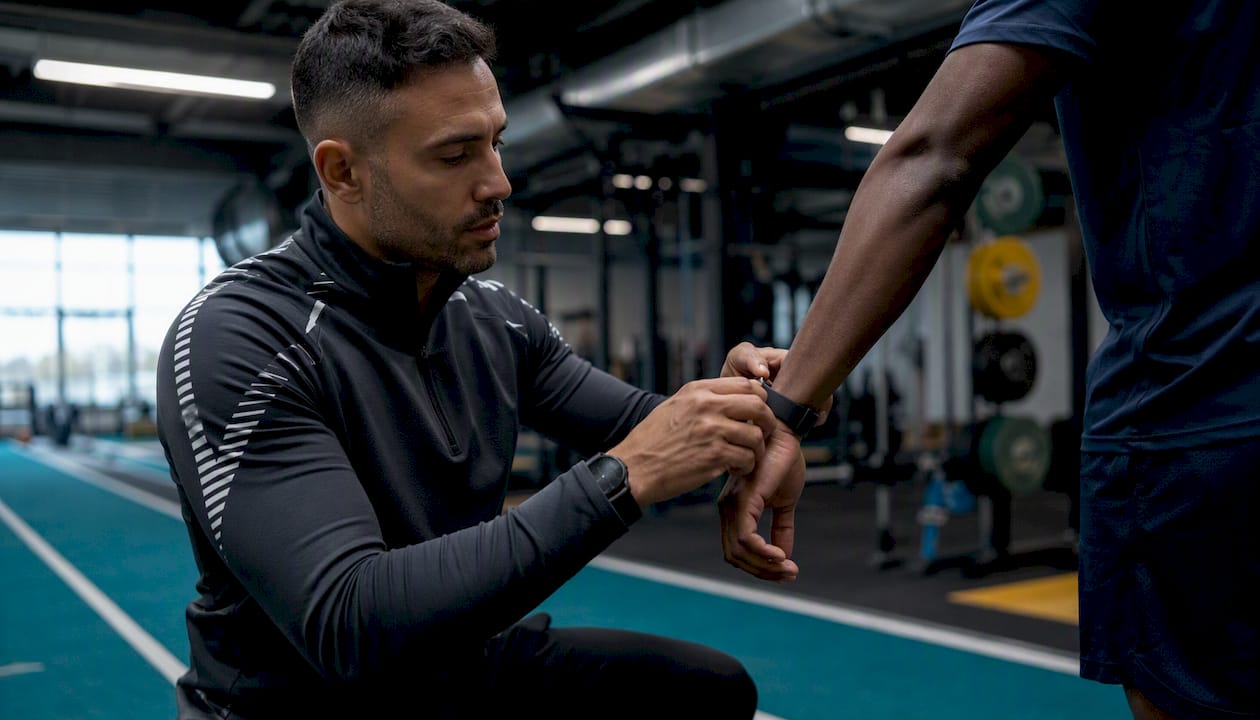
Choose a coach-centred athlete development platform that unifies wearables, video and session data into coach-ready insights. For UK coaches, that means a single system handling data capture, player-facing progress and GDPR-aware ownership, rather than three disconnected spreadsheets and a WhatsApp thread. Levelup360hq meets that brief directly: it combines coach workflows, gamified player development and multi-sport support in one platform built for clubs and academies.
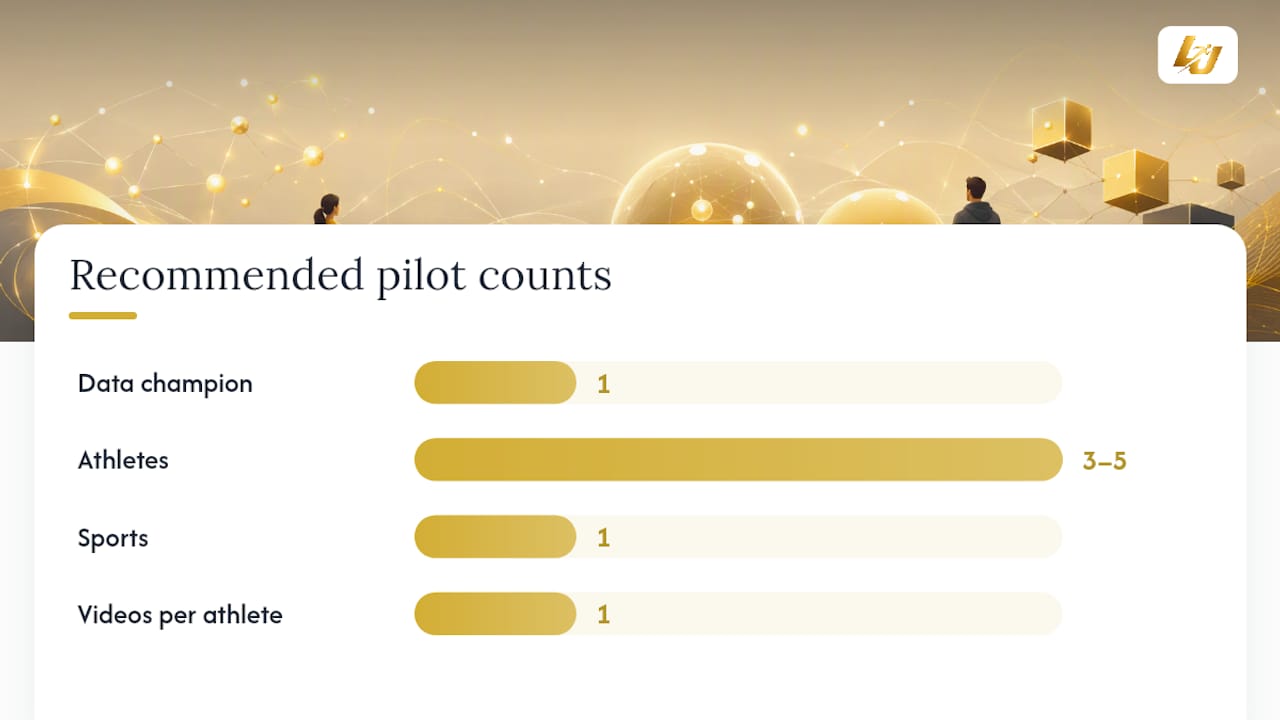
Your immediate next action: run a one-week pilot. Invite three to five athletes, collect physical load and one key skill metric per session, and define success as “coach spends under ten minutes reviewing data before the next session.” That single constraint forces you to pick a tool that actually fits your workflow rather than one that looks impressive in a demo.
Table of Contents
- What does data actually deliver for coaching decisions?
- Which metrics and assessments should coaches track, and how often?
- What tool types do coaches combine, and when does each one earn its place?
- How do you evaluate performance analytics tools before committing?
- What does a realistic pilot-to-rollout timeline look like for UK clubs?
- How Levelup360hq maps to the coaching checklist
- How do you integrate analytics with human insight, and what does UK GDPR require?
- What are the five practical next steps for UK coaches right now?
- Key takeaways
- Why the data-first coaching conversation is missing something
- Levelup360hq gives UK coaches a platform that athletes actually use
- Useful sources and further reading
What does data actually deliver for coaching decisions?
The honest answer: analytics convert observation into prioritised actions. Without data, a coach notices a player looks tired on Thursday and adjusts instinctively. With data, a readiness flag appears on Tuesday, and the coach adjusts training load before the problem compounds. That shift, from reactive to anticipatory, is where data in athletic decision-making pays off most clearly.
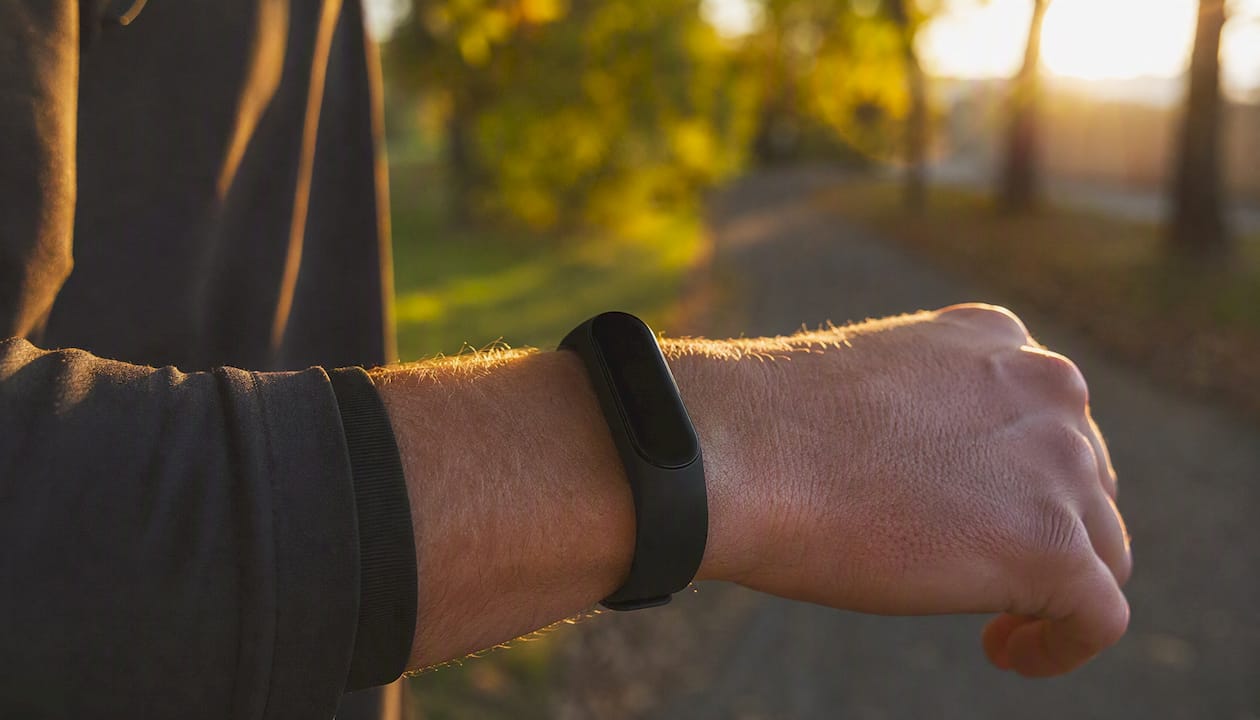
Workload management is the most immediate win. Tracking session load across a squad reveals which athletes are accumulating fatigue faster than their peers, which matters enormously for injury prevention and return-to-play decisions. Tactical pattern detection comes next: when you tag video clips to specific metrics, patterns in pressing success rates or transition efficiency become visible across multiple matches rather than relying on memory.
Data also supports the administrative side of coaching that rarely gets mentioned. Progress reports for parents, renewal evidence for academy directors, and selection rationales for scouts all become faster to produce when the data is already structured.
Specific coach tasks that data supports directly:
- Return-to-play: — objective load progression replaces gut feel during rehabilitation.
Pro Tip: Before choosing any platform, write down the single coaching question you most need answered this month. Then ask every vendor: “Show me exactly how your tool answers that question in under five minutes.” If they cannot, the tool is not ready for your workflow.
Which metrics and assessments should coaches track, and how often?
Start with the minimum viable set: physical load, readiness, one or two key skill success rates, one tactical action count, athlete wellbeing and engagement. That is six data points per athlete per week. Everything else is optional until the basics are embedded.
| Metric category | Example metrics | Typical measurement method | Recommended frequency |
|---|---|---|---|
| Physical load | Total distance, high-speed running distance, session RPE | GPS unit or manual RPE entry | Every session |
| Readiness / recovery | Sleep quality, muscle soreness, mood score | Athlete self-report app or survey | Daily or pre-session |
| Technical skill | Pass completion rate, shot accuracy, skill challenge score | Video tagging or coach assessment | Weekly or per match |
| Tactical | Pressing actions, transition involvements, positional compliance | Video analysis or GPS zone data | Per match / weekly review |
| Psychological wellbeing | Stress, motivation, confidence (e.g. SRSS or custom survey) | Short validated questionnaire | Weekly |
| Engagement | Session attendance, challenge completion, XP earned | Platform activity log | Ongoing / weekly summary |
Grassroots context: physical load via GPS is often impractical at grassroots level due to cost. RPE logged by the athlete on a mobile app is a credible, low-cost substitute. Wellbeing and engagement metrics are arguably more important at this level because dropout prevention is the primary challenge.
Academy and semi-professional context: GPS and heart-rate data become standard. The priority shifts to integrating physical, technical and tactical data in one view so the coaching staff can act on combined signals rather than siloed reports.
For a credible pilot, you need at minimum: one physical load measure, one skill metric and one wellbeing check-in per athlete per week. Three data points. If your chosen platform cannot collect those three things simply, it is not the right tool.
What tool types do coaches combine, and when does each one earn its place?
The most effective analytics stacks combine at least one data capture layer, one video or context layer and one insights or presentation layer. Those three layers can live in separate tools connected by APIs, or in a single integrated platform. The single-platform route is almost always better for coaching staff below elite level, because the cognitive overhead of managing three logins and three data exports is itself a barrier to consistent use.
| Tool type | Metrics captured | Typical integrations | Strengths | Limitations |
|---|---|---|---|---|
| GPS / wearable devices | Distance, speed, acceleration, heart rate, load | Athlete management systems, CSV export | Objective physical data; real-time alerts | Cost per unit; requires device management |
| Video analysis software | Tactical actions, technique clips, event tags | GPS platforms, manual tagging | Rich context; visual feedback for athletes | Time-intensive tagging; storage demands |
| Athlete management systems (AMS) | Load, wellness, skills, attendance, notes | Wearables, video, surveys, CRM | Central data store; coach and athlete dashboards | Can be complex to configure |
| Survey / wellbeing tools | RPE, mood, sleep, stress, motivation | AMS, mobile apps | Low cost; athlete-reported data | Relies on athlete compliance |
| Gamified development platforms | XP, ratings, challenges, engagement, skill assessments | Video, coach workflows, club CRM | High athlete engagement; coach and club workflows in one | Newer category; varies by sport coverage |
| Dashboards / BI tools | Any structured data | All of the above | Flexible visualisation | Requires data literacy; no capture layer |
Integration matters more than most coaches expect. When GPS data sits in one system, video in another and wellness surveys in a third, the coach ends up doing the integration manually in a spreadsheet. Platforms that handle API connections or native integrations between these layers remove that burden. For a practical overview of how athletic department data integration works in practice, the DepthChartIQ guide covers the technical and organisational patterns clearly.
A single platform becomes the right choice when: the coaching staff is small, data literacy is mixed, or the club needs athlete-facing features (progress cards, challenges, leaderboards) alongside coach-facing analytics. A best-of-breed stack makes sense only when each specialist tool is genuinely superior and someone on staff has the time and skill to manage the connections.
How do you evaluate performance analytics tools before committing?
Prioritise coach usability, data ownership, measurement fidelity and integration capability, in that order. A tool with excellent metrics that takes 45 minutes per session to operate will not be used. A tool that is quick to use but locks your data behind a proprietary export format is a long-term liability.
Numbered checklist for vendor demos and pilot evaluations:
- How long does initial setup take for a squad of 20 athletes? (Target: under two hours.)
- Can coaches log data from a mobile device on the pitch without Wi-Fi?
- Does the platform produce exportable reports in PDF or CSV without manual formatting?
- Is white-labelling available if the club needs branded athlete reports?
- Can you define custom metrics specific to your sport or methodology?
- What does the athlete-facing experience look like? Can players see their own progress?
- How is data backed up, and who owns it if you cancel the subscription?
- What is the onboarding support model: live training, documentation, or self-serve only?
For a structured comparison of what to look for across athlete development programmes, the DepthChartIQ 2026 guide offers a useful evaluation framework alongside the checklist above.
Questions to ask vendors directly:
- What is your data retention policy after contract termination?
- How do you handle UK GDPR compliance, particularly for athletes under 18?
- What is your support SLA for critical issues during a competition period?
- Can we add sport-specific metrics without a custom development contract?
Red flags that should stop a trial immediately:
- Data cannot be exported in a standard format (CSV, JSON, PDF).
- Processing a session’s data takes more than 15 minutes of manual work.
- Athletes have no visibility of their own progress or development data.
- The vendor cannot name the legal basis under which they process athlete data.
- Pricing changes significantly between the demo and the contract.
What does a realistic pilot-to-rollout timeline look like for UK clubs?
Top-line timeline: pilot (2–6 weeks) → evaluation (2–4 weeks) → phased rollout (4–12 weeks). Total elapsed time from first demo to full squad deployment typically runs 8–22 weeks, depending on squad size, data complexity and internal resource.
Pilot phase (weeks 1–6)
Run the pilot with a small group: one squad, one age group, or one coaching cohort. Collect the minimum viable dataset (physical load, one skill metric, wellbeing). The goal is not to prove the platform works; it is to prove your staff will use it consistently.
Assign a data champion, one person responsible for data quality, coach training and weekly review. Without this role, pilots stall. The data champion does not need to be a sports scientist; a technically confident coach or administrator works well.
Evaluation phase (weeks 7–10)
Review three things: data completeness (did athletes actually log their data?), coach adoption (did coaches change any decisions based on the data?), and time cost (how many hours per week did the platform consume?). If the time cost exceeds the value delivered, the tool is wrong or the workflow needs redesigning before rollout.
Phased rollout (weeks 11–22)
Expand squad by squad. Run a short training session (two to three hours) for each new coaching cohort. Migrate any historical data from spreadsheets or previous platforms at this stage, not during the pilot.
Cost shape for UK clubs
Budget bands vary considerably by context. Grassroots clubs typically work with tighter budgets and prioritise low per-athlete cost and minimal hardware. Academy and semi-professional environments can justify higher per-athlete investment when the platform replaces multiple point solutions.
Pricing models across the market generally follow one of three structures: flat subscription (per club per month), per-athlete pricing (scales with squad size), or a hybrid of platform fee plus per-athlete charge. Per-athlete models suit growing clubs because costs scale with actual usage. Flat subscriptions suit established clubs with stable squad sizes.
Allocate internal resource realistically: a data champion spending three to five hours per week during the pilot, two to four hours of coach training per person, and minimal IT support if the platform is cloud-based and requires no on-premises infrastructure.
How Levelup360hq maps to the coaching checklist
Levelup360hq aligns to coach jobs-to-be-done by combining player cards, video assessments and coach workflows in a single platform, rather than asking clubs to assemble and manage a stack of separate tools.
The platform’s feature set maps directly to the selection checklist:
- Live player cards with real-time ratings: athletes see their own progress in a format they recognise, which drives engagement and reduces the dropout problem that grassroots and academy coaches face constantly.
- XP challenges and tier progression: coaches set development targets; athletes earn experience points for completing them. The gamification layer is not cosmetic; it changes how often athletes voluntarily engage with their own data.
- Video assessments with approval workflows: coaches record or upload assessment clips, review them, and approve or return them with feedback. The workflow is built into the platform rather than managed via email and shared drives.
- White-label club portals: academies and clubs can brand the platform as their own, which matters for renewal conversations and for presenting a professional face to parents and scouts.
- Session and syllabus management: coaches build structured programmes and track athlete progress against them, producing the kind of longitudinal evidence that academy directors and parents ask for at review time.
- Multi-sport support: football, cricket, netball and rugby are all supported, which matters for multi-sport clubs that cannot justify separate platforms per sport.
- CRM, subscription management and store integration: the club management layer means the platform earns its cost across the whole organisation, not just the performance staff.
Against the checklist: setup is designed for non-technical users; the mobile experience supports field data entry; reports are exportable; white-labelling is available; and data ownership sits with the club. The interactive prototype lets you validate the coach workflow before committing to a subscription, which is the most efficient way to run a pre-pilot evaluation.
Recommended small pilot plan:
- Roles: one data champion (coach or administrator), three to five athletes, one sport.
- Metrics to collect: player card ratings, one XP challenge completion rate, one video assessment per athlete.
- Success criteria: data champion spends under ten minutes on weekly review; at least 80% of athletes log in at least twice per week; coach can produce one progress report without manual formatting.
Pro Tip: Use the interactive prototype to run a mock review session with your data champion before inviting athletes. Identify any workflow friction before it becomes a compliance problem during the live pilot.
How do you integrate analytics with human insight, and what does UK GDPR require?
Data is a decision support tool, not a replacement for coaching judgement. A readiness score of 4 out of 10 is a prompt to have a conversation, not an automatic instruction to drop an athlete from training. The coaches who get the most from analytics are the ones who treat automated flags as questions rather than answers.
Building coach buy-in
Start with small wins. Show coaches one insight from the first week of the pilot that they could not have seen without the data. A single example, such as identifying that a specific athlete’s wellbeing scores drop consistently on Thursdays, is more persuasive than any feature list. Player-facing summaries help too: when athletes engage with their own progress cards, coaches see the motivational effect directly, which builds confidence in the platform.
A data champion is the single most important adoption factor. This person runs the weekly data review, fields coach questions and escalates issues to the vendor. Without that role, data quality degrades within weeks.
What are the five practical next steps for UK coaches right now?
The recommendation is straightforward: choose a unified, coach-centred platform that handles data capture, athlete engagement and club management in one place, run a short pilot, and expand only after the workflow is proven.
Five ordered next steps for the next 30–90 days:
- Run a 2–4 week pilot with a small group (weeks 2–5): use the Levelup360hq prototype to validate the workflow first, then invite three to five athletes and collect your minimum dataset consistently.
What success looks like at pilot completion: the data champion can produce a progress report for any athlete in under five minutes; coaches reference data in at least one session planning conversation per week; athletes are logging in voluntarily, not just when reminded.
Key takeaways
The most effective approach to performance analytics for coaches is a unified platform that covers data capture, athlete engagement and club management, deployed via a short structured pilot before full rollout.
| Point | Details |
|---|---|
| Start with six core metrics | Physical load, readiness, one skill rate, one tactical count, wellbeing and engagement cover the essentials without overwhelming staff. |
| Appoint a data champion first | One named person responsible for data quality and coach training is the single biggest factor in pilot success. |
| Pilot before you commit | A 2–6 week pilot with three to five athletes reveals workflow friction before it affects the whole squad. |
| Data ownership and UK GDPR matter | Confirm the club owns its data, obtain parental consent for under-18s, and define a retention policy before going live. |
| Levelup360hq as the recommended platform | Levelup360hq combines player cards, video assessments, XP challenges and white-label club portals in one platform built for UK multi-sport clubs. |
Why the data-first coaching conversation is missing something
Most articles about sports performance analytics software focus almost entirely on the technology: which platform captures the most metrics, which GPS unit has the best accuracy, which dashboard looks sharpest. That framing misses the actual problem coaches face, which is not a shortage of data but a shortage of time to act on it.
The coaches who get the most from analytics tools are not the ones with the most sophisticated stacks. They are the ones who picked one or two metrics that genuinely changed their decisions, built a consistent collection habit, and used the data as a prompt for conversations rather than a substitute for them. A readiness score does not tell you why an athlete is tired. It tells you to ask.
The gamification angle in platforms like Levelup360hq is often dismissed as a gimmick by performance staff who have come up through traditional sports science. That scepticism is understandable but misplaced. Athlete engagement with their own data is the hardest part of any analytics programme to sustain. When athletes check their player cards voluntarily, complete XP challenges without being prompted, and compare their progress on leaderboards, the coach gets richer, more consistent data with less chasing. The engagement layer is not decoration; it is the compliance mechanism.
The other thing most guides understate: the cost of switching platforms after a year of data collection is significant. Export formats, data migration, retraining staff, rebuilding athlete buy-in. Choose a platform with clean data export and confirmed ownership from day one, not as an afterthought when the contract renewal arrives.
Levelup360hq gives UK coaches a platform that athletes actually use
Most analytics tools are built for performance scientists, not coaches. Levelup360hq is built for the whole club: coaches get video assessments, approval workflows and session management; athletes get live player cards, XP challenges and tier progression that make development visible and motivating; club administrators get white-label branding, CRM, subscription management and store integration in one place.
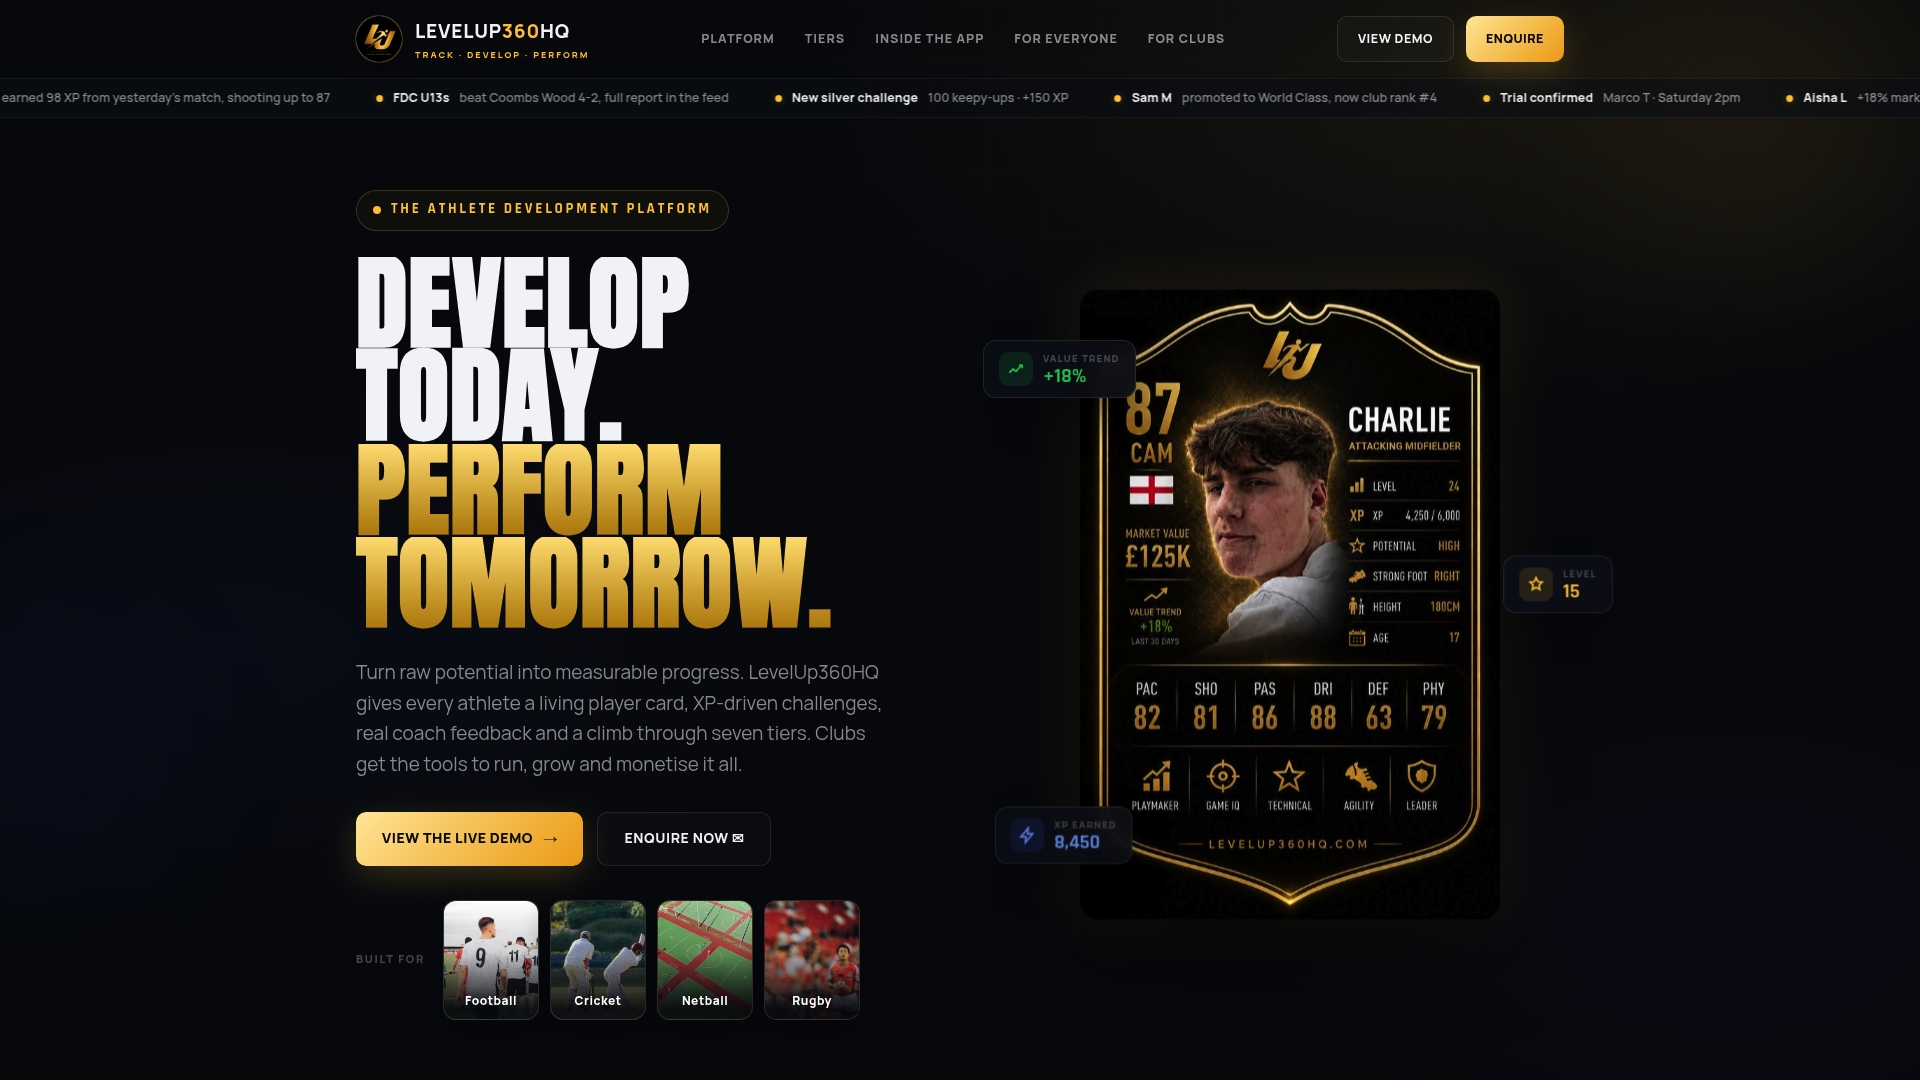
The concrete difference for UK clubs is this: instead of paying separately for an athlete management system, a video platform and a parent-reporting tool, Levelup360hq covers all three under one subscription, with per-athlete pricing that scales with your squad. It supports football, cricket, netball and rugby, so multi-sport clubs do not need separate platforms per sport.
The fastest way to see whether it fits your workflow is to walk through the interactive prototype with your data champion before inviting any athletes. The prototype demonstrates player cards, challenges and coach workflows in full. If it answers your priority coaching question in under five minutes, book a pilot. If it does not, you have saved yourself a wasted onboarding cycle.
Visit Levelup360hq to review club plans and start a pilot conversation with the team.
Useful sources and further reading
- LevelUp360HQ · Track · Develop · Perform
- LevelUp360HQ — Prototype
- The Role of Data in Athletic Decision-Making — DepthChartIQ
- Compare Programs for Athlete Development: 2026 Guide — DepthChartIQ
- How Athletic Department Data Integration Works — DepthChartIQ
Recommended
Turn potential into a player card.
LevelUp360 tracks every match, builds your child's player card, and shows their development over time.
Get started free