Performance analytics for athletes: what the data actually changes
Published 19 September 2026
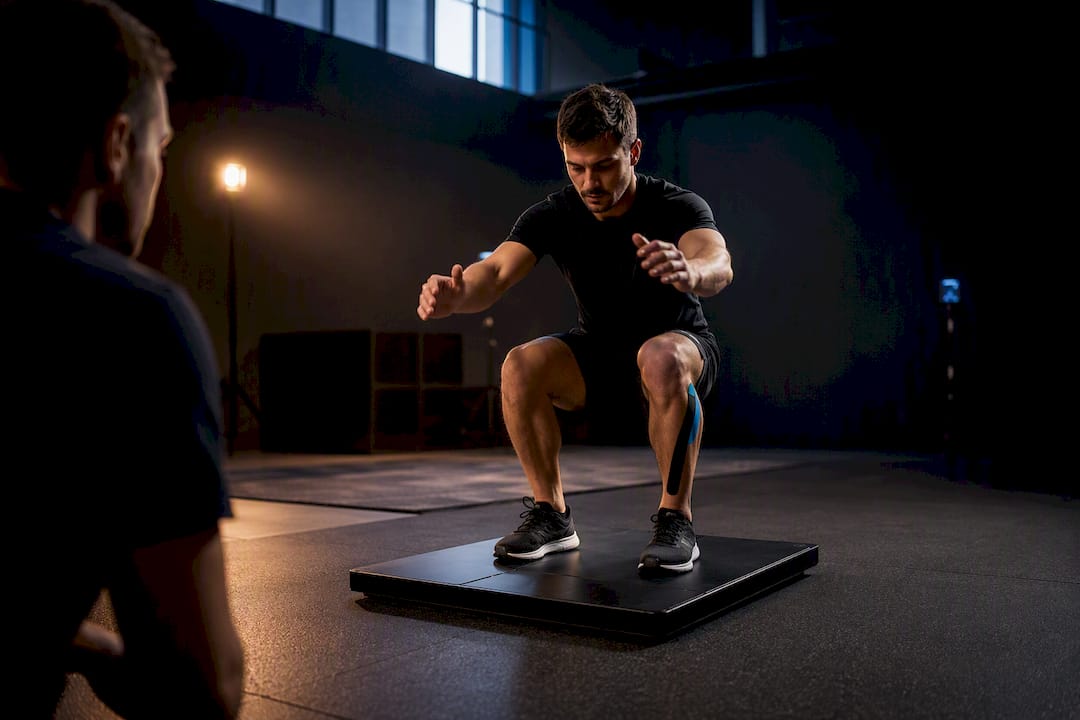
Performance analytics turns training and match data into objective decisions that improve training quality, cut preventable injury risk and track athlete development over time. It works for anyone tracking numbers against outcomes: athletes watching their own progress, coaches setting training loads, and medical staff spotting warning signs before they become injuries. The value isn’t in the data itself but in what a coach or athlete does with it the following week…
TL;DR:
- Combining external load data with internal responses and subjective wellness scores creates more reliable performance KPIs than relying on single metrics alone.
- Wearable GPS devices, video systems, and lab tests each have limitations, so using multiple data sources improves accuracy and contextual understanding.
- Load monitoring helps identify training volume spikes but cannot predict injuries; a layered approach with human review remains essential.
- Implementing performance analytics requires clear outcome-based KPIs, simple data routines, decision rules, and regular pruning of ineffective metrics.
- Engagement tools like live player cards and structured workflows increase athlete participation and turn data into actionable daily coaching decisions.
Table of Contents
- What is performance analytics for athletes, really?
- Which metrics and KPIs actually matter?
- How do wearables, video and lab tests capture the data?
- Does load monitoring actually prevent injuries?
- How do you actually implement performance analytics?
- A working example: analytics inside a gamified development platform
- Where analytics should sit in the decision, and where it shouldn’t
- How Levelup360hq turns analytics into daily coaching action
- Sources
- FAQ
What is performance analytics for athletes, really?
Performance analytics for athletes is the practice of collecting, structuring and interpreting movement, physiological and skill data to guide training and competition decisions. Most confusion starts with mixing up two things that measure different problems: external load and internal load.
External load is what the body actually does. Distance covered, sprint counts, jump height. Internal load is how the body responds to that work. Heart rate, perceived exertion, sleep quality. A player can rack up identical external load two weeks running and respond completely differently each time, which is precisely why tracking only one side gives a false picture.
Analytics also splits into descriptive and predictive layers. Descriptive analytics tells you what happened last match: distance covered, top speed hit, pass success rate. Predictive and prescriptive analytics goes further, flagging patterns that suggest fatigue building or recommending a load adjustment before an issue shows up. The scope of sport performance analytics has expanded from manual notation to exactly this kind of automated, contextual modelling.
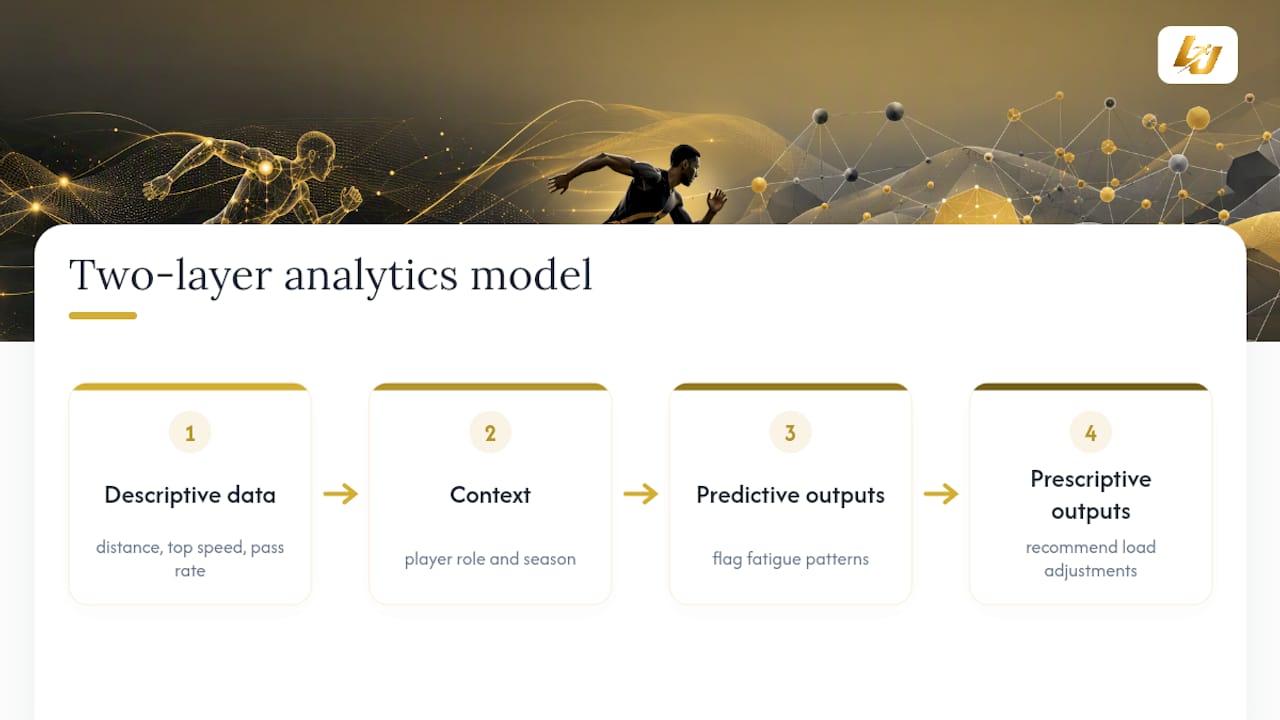
Context changes what a number means. A centre back’s sprint count reads nothing like a winger’s. Pre-season numbers mean something different from in-season numbers. Analytics improves decisions and reveals patterns a single eye would miss. It doesn’t replace coaching judgement, and it won’t guarantee results on matchday.
Which metrics and KPIs actually matter?
Not every metric earns a place on your dashboard. The trap most programmes fall into is collecting everything a device can output and acting on none of it. Build KPIs from combinations of metrics, not single numbers pulled in isolation.
- External load metrics: GPS-derived total distance, top speed, high-speed running distance, accelerations and decelerations, sprint counts.
- Internal load metrics: heart rate zones, heart rate variability (HRV), session RPE (rating of perceived exertion).
- Performance tests: countermovement jump height, reactive strength index, and lab-based outputs like VO2 max or force plate data.
- Skill and event metrics: sport-specific tagging such as pass completion, shot quality, tackles won, or turnover rate.
The mistake to avoid is treating any single figure as a “magic threshold”. KPIs work best as a combination: pair an external load figure with an internal response figure and a subjective wellness score, and only then draw a conclusion.
How do wearables, video and lab tests capture the data?
Different capture methods suit different budgets and levels of precision. GNSS and GPS wearables reliably measure distance, speed and acceleration outdoors, though accuracy drops indoors and in tightly packed team sports where satellite signal gets obstructed.
Video and computer vision have closed that gap fast. Camera-based systems can now detect events automatically, tag context (who touched the ball, where, under what pressure) without a wearable on the athlete at all. Enterprise cloud platforms illustrate the ceiling here: vendor systems built on infrastructure like AWS’s sports analytics tools can generate hundreds of distinct metrics per player per match with near-instant processing for live analysis. That same cloud shift is what lets a camera-only setup replace GPS vests for teams that can’t afford them.

Lab and field tests (jump mats, force plates, timing gates) still matter for benchmarking, since wearables and video need something to validate against. Subjective data, wellness questionnaires, sleep logs, RPE scores, fill the gap objective sensors can’t reach: motivation, soreness, mental fatigue. Whatever the mix, latency and syncing between systems needs checking regularly, or the dashboard quietly drifts out of step with reality.
Does load monitoring actually prevent injuries?
Load monitoring tracks spikes in training volume and flags adherence problems. It does not predict injury with any certainty, and treating it as though it does is where most programmes go wrong.
The acute:chronic workload ratio (ACWR) became popular as a single number meant to flag “danger zones”, but it has genuine problems. It compresses a lot of individual variation into one ratio, ignores context like age, injury history and sport demands, and treats a fixed cutoff as universal when it isn’t. Practical sports science guidance now recommends layered approaches over any single metric, combining objective load data with subjective wellness scores and movement-quality screening.
The safer model pairs a load alert with a human check: a physiotherapist or clinician reviewing the athlete, not an automated system pulling them from training on a formula alone. Flagged alerts work as conversation starters, not verdicts. If athletes learn the system benches them without explanation, trust erodes fast, and they stop reporting honestly.
How do you actually implement performance analytics?
Most programmes stall not from lack of data but from lack of a workflow that turns data into weekly decisions. Here’s a path that works whether you’re running a school team or an academy programme.
- Define outcome-based KPIs first. Start from the sport and the athlete’s actual goals, not from what a device can measure. A sprinter needs different KPIs from a midfielder.
- Pick a minimum viable data set. One external measure (GPS distance or video-tagged events), one internal measure (HR or session RPE), one subjective measure (a wellness questionnaire). Resist adding a fourth stream until the first three are working.
- Build simple capture and QA routines. A weekly dashboard that a coach actually opens beats a sophisticated one nobody checks. Set a fixed day for data review.
- Set decision rules in advance. Decide what a flagged metric triggers: a conversation with the athlete, a modified session, or a referral to medical staff. Write the escalation path down before you need it.
- Review monthly and prune. Drop metrics nobody’s acting on. If a KPI hasn’t changed a single training decision in eight weeks, it’s dashboard clutter.
Pro Tip: Run your first month on paper or a spreadsheet before buying software. You’ll learn which metrics your coaching staff actually reference, and you’ll stop paying for dashboards nobody opens.
Staff training closes the gap between collecting data and using it well. Short courses, including Coursera’s sports analytics specialisation, and hands-on options like the UWF continuing education workshop, give staff the applied grounding that a dashboard alone won’t teach.
A working example: analytics inside a gamified development platform
Live player cards illustrate the implementation steps above in practice. Real-time ratings turn a raw metric feed (distance covered, skill success rate, session attendance) into a single number the athlete actually checks, which converts data collection into daily engagement rather than a quarterly report nobody reads.
Coaches operationalise the analysis through video assessments with structured approval workflows, so a tagged clip becomes a training instruction, not just footage sitting in a folder.
- Session and syllabus management tools turn weekly KPI reviews into scheduled coaching actions.
- Club-level features, white-label branding, CRM, integrated payments, support programmes running this at scale without rebuilding admin systems from scratch.
- Badge and tier progression systems give athletes a visible reason to engage with their own data.
Athletic performance also has a documented spillover into visibility: a study of Swiss Olympic athletes found a measurable positive correlation between performance and social media engagement rate (r = .288, p < .01), though performance alone didn’t guarantee follower growth. Analytics that surface achievement moments, personal bests, milestone badges, give athletes something worth sharing.
Where analytics should sit in the decision, and where it shouldn’t
Data narrows uncertainty; it doesn’t remove judgement. A flagged load spike or a dip in jump height is a prompt for a conversation with the athlete and, where relevant, a clinician, not an automatic verdict.
Athletes should own their own data and understand what’s collected and why. Consent isn’t paperwork; it’s what keeps reporting honest. Cloud and AI will keep making analytics cheaper and more scalable, letting smaller clubs run what only elite programmes could afford a decade ago. But scale doesn’t replace context. A coach who knows an athlete’s history will always read a number differently than a model trained on averages, and that difference is where the real coaching happens.
— Chris
How Levelup360hq turns analytics into daily coaching action
Most clubs don’t struggle to collect data. They struggle to get athletes to look at it and coaches to act on it consistently, week after week. Levelup360hq is built around that specific gap: instead of a dashboard sitting unopened in a browser tab, it turns metrics into live player cards, XP challenges and tier progression that athletes actually check.

Coaches get video assessment and approval workflows that map straight onto the implementation steps above, tagging a clip, setting a decision, tracking the follow-through, without juggling three separate tools. Clubs and academies run the whole thing under their own branding, with CRM, payments and store integration handling the admin side. Pricing runs on the Pro plan at £49 per month, plus a £1.50 per month active athlete platform fee. If you’re ready to see how your own training data could look on a live player card, book a walkthrough of the platform or explore the full feature set on the Levelup360hq site.
Sources
- Engagement and follower growth study — Current Issues in Sport Science
- Performance Analytics for Sports on AWS
- Sports Performance Analytics Specialization
- Sport performance analytics workshop — UWF Continuing Education
FAQ
What is performance analytics in sport?
Performance analytics in sport is the structured collection and interpretation of movement, physiological and skill data to inform training and competition decisions. It spans everything from GPS-tracked distance to video-tagged passing accuracy, combined to guide what a coach does next.
Can you give an example of performance analysis in sport?
A common example is tracking a footballer’s high-speed running distance across a season alongside their session RPE and jump height. When distance rises but jump height drops, that combination flags fatigue building, prompting a coach to adjust the next session rather than push through.
How does performance analysis benefit athletes?
It gives athletes objective evidence of their own development instead of relying on gut feel, and it helps coaches catch load spikes before they turn into injuries. It can also feed athlete visibility, since performance correlates with social media engagement among elite athletes, though performance alone won’t guarantee a following.
How do you measure athlete performance?
Athlete performance is measured through a mix of external metrics (distance, speed, sprint counts from GPS or video), internal metrics (heart rate, HRV, session RPE), and periodic tests like jump height or lab-based fitness assessments. The strongest picture combines several of these rather than relying on one number. Platforms like Levelup360hq translate that combination into a single live rating athletes can track daily.
What tools do coaches use for performance analytics?
Coaches typically combine GPS or video tracking hardware, cloud-based analytics platforms, and simpler engagement tools that turn raw metrics into athlete-facing feedback. For older or returning athletes specifically, structured progress tracking methods help separate genuine fitness gains from normal week-to-week variation.
Turn potential into a player card.
LevelUp360 tracks every match, builds your child's player card, and shows their development over time.
Get started free