How youth performance tracking works: a guide for coaches
Published 10 July 2026

Youth performance tracking is the systematic process of collecting and analysing physical, technical, and psychological data to monitor and improve young athletes’ development. Understanding how youth performance tracking works gives coaches, parents, and sports professionals the tools to make decisions grounded in evidence rather than instinct alone. A multidimensional model combining physical, technical, and psychological indicators achieves 78.3% accuracy in youth talent classification, compared to 62.5% for traditional physical-only methods. That gap is not a minor statistical footnote. It represents the difference between identifying the right athletes and missing them entirely.
How does youth performance tracking work?
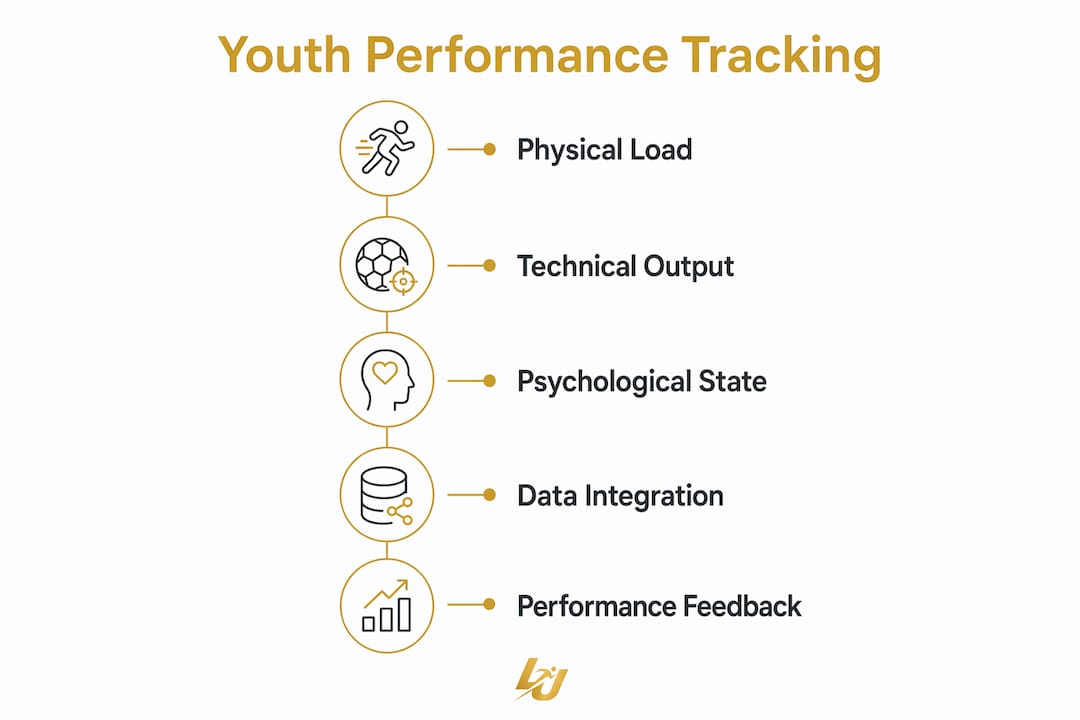
Youth performance tracking operates across three distinct data layers: physical load, technical and tactical output, and psychological state. Each layer captures a different dimension of an athlete’s development. Together, they form a profile that no single metric can produce alone.
The industry term for this approach is multidimensional athlete monitoring. It draws on wearable technology, video analysis, and athlete feedback tools to build a complete picture of performance over time. Coaches who rely on only one layer, typically physical data, miss the psychological and technical signals that often predict long-term success more reliably than sprint times or jump height.
Physical load data comes from wearable GPS and IMU sensors that record distance covered, acceleration, deceleration, and speed. A threshold of 5.5 m/s is widely used to classify high-speed running activity in youth sports. That figure gives coaches a consistent benchmark for comparing training intensity across sessions and athletes.

Video analysis sits in the second layer. Coaches use recorded footage to assess technical execution, positional decision-making, and tactical awareness. This is where you see whether an athlete’s physical output translates into effective play, or whether technical weaknesses are limiting their potential.
The third layer uses app-based tools to capture subjective data: perceived exertion, mood, motivation, and fatigue. These inputs are easy to dismiss as “soft” data, but psychological and cognitive traits such as decision-making speed and motivational drive consistently differentiate elite youth athletes from their peers.
Pro Tip: Never report physical data without pairing it with at least one subjective measure. An athlete recording high physical output alongside low motivation scores is a warning sign, not a success story.
Why does multidimensional tracking outperform single-factor monitoring?
The accuracy gap between multidimensional and physical-only models is the clearest argument for integrated tracking. A 78.3% classification accuracy versus 62.5% means fewer athletes are wrongly assessed, fewer are overlooked, and development programmes are built on more reliable foundations.
| Model type | Accuracy | Key indicators used |
|---|---|---|
| Multidimensional integrated | 78.3% | Physical, technical, psychological |
| Traditional physical-only | 62.5% | Speed, strength, endurance |
The table above shows the practical cost of ignoring psychological and technical data. A youth athlete who scores modestly on physical tests but demonstrates strong executive function and high intrinsic motivation is likely to outperform a physically dominant peer over a two-year development window. Physical-only models miss that athlete entirely.
Biological maturity is the other critical variable that single-factor monitoring ignores. Chronological age correlates poorly with athletic performance in youth sports. Two 14-year-olds can differ by two or more years in biological development, which distorts every physical comparison between them. Using peak height velocity to adjust performance percentiles produces fairer, more predictive assessments.
Multidimensional tracking also reduces selection bias. When psychological maturity, motivation, and technical skill carry equal weight alongside physical metrics, late developers and less physically imposing athletes receive fairer evaluations. That matters for retention. Integrating psychological assessments alongside physical and technical measures reduces drop-out rates and improves selection accuracy across youth programmes.
Pro Tip: When comparing athletes of the same chronological age, always note their biological maturity stage. A physically dominant 13-year-old who is biologically 15 may be outperformed within 18 months by a peer who is still maturing.
How can coaches and parents use performance data effectively?
Raw data without context is noise. The most effective use of youth performance metrics involves translating numbers into clear, comparative narratives that athletes and parents can act on.
Radar charts and benchmarked progress reports are the most effective format for communicating performance data to non-specialists. Showing a parent that their child ranks in the top third of their age group for technical execution, but needs work on high-speed running volume, is far more useful than presenting a spreadsheet of raw scores. Visual reports increase engagement and make feedback conversations more productive.
Evaluation frequency matters as much as format. Focused skill evaluations every 2–4 weeks, embedded into regular practice sessions, generate the consistent data needed to spot trends. Infrequent assessments create gaps that make it impossible to distinguish genuine improvement from day-to-day variation.
Practical applications of tracking data include:
- Training load adjustments: If an athlete’s high-speed running distance drops over three consecutive sessions, reduce intensity before injury occurs rather than after.
- Technical focus areas: Video analysis data showing repeated positional errors in the same game phase points to a specific coaching intervention, not a general fitness concern.
- Motivation monitoring: A sustained drop in subjective wellbeing scores signals a need for a conversation, not an increase in training volume.
- Parent communication: Sharing progress relative to age-group benchmarks builds trust and keeps families engaged with the development process.
Transparency and contextual feedback matter more to parents and coaches than raw numbers. Progress shown relative to peers improves motivation and trust in the coaching process. That finding should inform how every performance report is structured and delivered.
Pro Tip: Keep evaluation protocols under 15 minutes per session. Long assessments disrupt training flow and reduce compliance. Short, focused check-ins produce better data over time than infrequent, exhaustive tests.
What are the common challenges in youth performance tracking?
The biggest challenge in youth performance tracking is not technology. It is interpretation. Data collected without sufficient context produces misleading conclusions, and those conclusions affect real athletes’ development pathways.
Biological maturity remains the most frequently overlooked variable. Coaches who compare raw physical scores across an age group without accounting for developmental stage risk systematically favouring early maturers. Injury history and recovery status compound this problem. An athlete returning from injury will produce suppressed performance scores that reflect their health status, not their ability.
Common pitfalls in youth performance analysis include:
- Inconsistent data collection: Tracking that happens sporadically produces unreliable trend data. Consistency in method, timing, and conditions is non-negotiable.
- Over-reliance on single metrics: Using sprint speed alone to assess an athlete’s potential ignores technical, tactical, and psychological dimensions that predict long-term success.
- Ignoring context: A poor session following a school exam period or a family disruption is not a performance decline. Human expertise is required to interpret data within its context.
- Technology access gaps: Clubs with limited budgets cannot always deploy GPS wearables or video analysis systems. Simpler, app-based tools can capture psychological and subjective data without significant cost.
The solution is not more data. It is better interpretation. Coaches need training in reading performance profiles, not just collecting them. Parents need clear explanations of what the numbers mean and what they do not mean.
How is youth performance tracking evolving?
The next generation of youth performance tracking combines artificial intelligence, computer vision, and multi-sensor platforms to produce more accurate and personalised assessments. These developments are moving tracking from a retrospective reporting tool into a predictive coaching instrument.
Key developments shaping the field include:
- AI-enhanced video analysis: Computer vision systems can now track player movement, positioning, and technical execution automatically, reducing the time coaches spend reviewing footage manually.
- Multi-sensor data integration: Platforms that combine GPS, heart rate, sleep, and subjective feedback into a single dashboard give coaches a complete daily picture of athlete readiness.
- Cognitive and psychological assessment tools: New methods are producing more ecologically valid measures of decision-making, attention, and resilience, moving beyond simple questionnaires.
- Machine learning for injury prediction: Algorithms trained on training load and recovery data can flag fatigue patterns before they become injuries, giving coaches time to intervene.
- Data-sharing platforms: Systems that connect coaches, athletes, and parents in a shared data environment improve communication and keep all parties aligned on development goals.
Platforms like Levelup360hq are built around this integrated model, combining performance analytics, visual reporting, and athlete engagement tools in a single environment designed for coaches and clubs across multiple sports.
Key takeaways
Effective youth performance tracking requires integrating physical, technical, and psychological data, because multidimensional models achieve 78.3% classification accuracy versus 62.5% for physical-only approaches.
| Point | Details |
|---|---|
| Use multidimensional models | Combining physical, technical, and psychological data increases talent classification accuracy significantly. |
| Account for biological maturity | Chronological age is a poor predictor; use peak height velocity to adjust performance comparisons fairly. |
| Evaluate every 2–4 weeks | Regular, focused assessments embedded in practice generate reliable trend data for coaching decisions. |
| Visualise data for parents | Radar charts and benchmarked reports improve understanding and trust far more than raw score sheets. |
| Interpret data in context | Injury history, motivation scores, and life factors must inform how performance numbers are read. |
The part technology cannot do for you
I have worked with coaches who collect excellent data and do almost nothing useful with it. The spreadsheet exists. The GPS reports are filed. The video clips are saved. And the athlete in front of them is still being coached on gut feel and habit. That is the real problem in youth performance tracking, and no amount of technology solves it.
What I have found works is treating data as a prompt for a conversation, not a verdict. When I see an athlete’s subjective wellbeing scores drop over three weeks while their physical output stays high, that is not a green light. That is a signal to sit down with the athlete and ask what is going on. The data opens the door. The coach has to walk through it.
The multidimensional model is compelling precisely because it forces you to look at the whole athlete. A 78.3% accuracy rate sounds clinical, but what it really means is that you are less likely to write off a quiet, technically gifted 13-year-old because they cannot yet match the sprint times of a biologically older peer. That is a human outcome, not a statistical one.
My advice to coaches and parents is this: start with the data you can actually collect consistently, interpret it with context, and share it transparently. The technology will keep improving. The discipline of using it well is what separates good programmes from great ones.
— Chris
Levelup360hq and multidimensional athlete development
Coaches and parents who want to put these principles into practice need a platform that handles the complexity without adding administrative burden.

Levelup360hq brings together performance analytics, visual benchmarking, and athlete engagement tools in one place. The platform supports video assessments, session management, and progress reporting across football, cricket, netball, rugby, and more. Coaches get clear data dashboards. Athletes see their development through live player cards, XP progression, and badge systems that make tracking feel meaningful rather than clinical. Parents stay informed through transparent, contextual reports. Explore the platform or take a look at the interactive demo to see how multidimensional tracking works in practice.
FAQ
What does youth performance tracking measure?
Youth performance tracking measures physical load, technical and tactical output, and psychological state. The most accurate models combine all three domains rather than relying on physical data alone.
How often should youth athletes be evaluated?
Focused skill evaluations every 2–4 weeks, embedded into regular practice, produce the most reliable trend data. Infrequent assessments make it impossible to distinguish genuine progress from daily variation.
Why does biological maturity matter in youth tracking?
Biological maturity predicts athletic performance more accurately than chronological age. Two athletes of the same age can differ by two or more years in development, which distorts physical comparisons if maturity is not accounted for.
What is the most effective format for sharing performance data with parents?
Radar charts and benchmarked progress reports that show an athlete’s scores relative to age-group averages are the most effective format. Contextual, visual feedback improves motivation and trust more than raw data sheets.
Can smaller clubs track youth performance without expensive technology?
Yes. App-based tools that capture subjective feedback on fatigue, motivation, and perceived exertion require minimal cost and provide the psychological data layer that physical-only systems miss entirely.
Recommended
Turn potential into a player card.
LevelUp360 tracks every match, builds your child's player card, and shows their development over time.
Get started free