How club analytics improve programme decisions
Published 22 July 2026

How club analytics directly improve programme decisions
Club analytics turns scattered operational data into decisions you can act on today, not next quarter. The core mechanism is the four-pillar framework: descriptive analytics tells you what happened, diagnostic analytics explains why, predictive analytics forecasts what comes next, and prescriptive analytics recommends what to do about it. Used together, these four types reduce uncertainty and sharpen resource allocation across every department.
The practical gains are real and measurable. 56% of organisations report that analytics leads to faster, more effective decision-making. For a club manager juggling membership renewals, squad selection, and facility scheduling simultaneously, that speed is the difference between catching a problem early and managing a crisis.
- Descriptive: Membership visit frequency, revenue by department, session attendance
- Diagnostic: Why retention dropped after a pricing change, or why injury rates spiked in pre-season
- Predictive: Which members are likely to lapse in the next 30 days
- Prescriptive: Specific outreach actions, training load adjustments, or staffing changes to act on those predictions
Real-time dashboards put these insights in front of the right people without requiring a data analyst in the room. A general manager can review a club-wide operational snapshot in under two minutes. A coach can pull a player’s load metrics before a session. That accessibility is what makes analytics a leadership tool rather than a back-office function.
Why data analytics matters in sports clubs
Gut instinct has its place in sport, but it scales poorly. When a head coach makes squad decisions based on feel, or a club manager sets membership pricing on last year’s numbers, the margin for error compounds across a full season. Analytics replaces that guesswork with evidence.
The shift matters most in three areas. First, scouting and talent identification: clubs that track objective performance metrics across age groups spot development trajectories that subjective observation misses. Second, member behaviour: understanding when and why members disengage lets clubs intervene before a resignation letter arrives. Third, operational planning: connecting facility usage, staffing costs, and revenue data reveals inefficiencies that no single department report would surface.
- Analytics removes personal bias from performance assessments
- Evidence-based reviews create accountability across coaching and management teams
- Transparent data builds trust with boards, funders, and local authority partners
- Clubs can benchmark against sector standards rather than guessing at their own position
The clubs pulling ahead in 2026 are not the ones with the biggest budgets. They are the ones asking better questions of the data they already generate.
How clubs collect and process data for effective analytics
Every club already produces data. Tee sheets, point-of-sale systems, CRM records, fitness tracking devices, booking platforms, and member engagement logs all generate signals continuously. The problem is rarely a shortage of data. It is that those streams sit in separate systems that never talk to each other.
This fragmentation, sometimes called the “piggy bank problem,” means managers spend hours manually pulling spreadsheets together before they can even begin to analyse anything. Unified analytics platforms solve this by integrating all data streams into a single environment, eliminating manual consolidation and enabling real-time synthesis. The result is that a report requiring half a day of staff effort becomes a live view available in under a minute.
| Data source | What it captures | Analytics application |
|---|---|---|
| CRM and membership records | Join dates, renewal history, contact preferences | Retention risk scoring, renewal forecasting |
| Point-of-sale systems | Spend by member, category, time of day | Revenue trend analysis, pricing decisions |
| Fitness and wearable data | Load, recovery, heart rate variability | Injury prevention, training load management |
| Booking and scheduling systems | Facility usage, peak times, no-show rates | Staffing optimisation, capacity planning |
| Member engagement logs | App logins, event attendance, communication opens | Engagement scoring, personalised outreach |
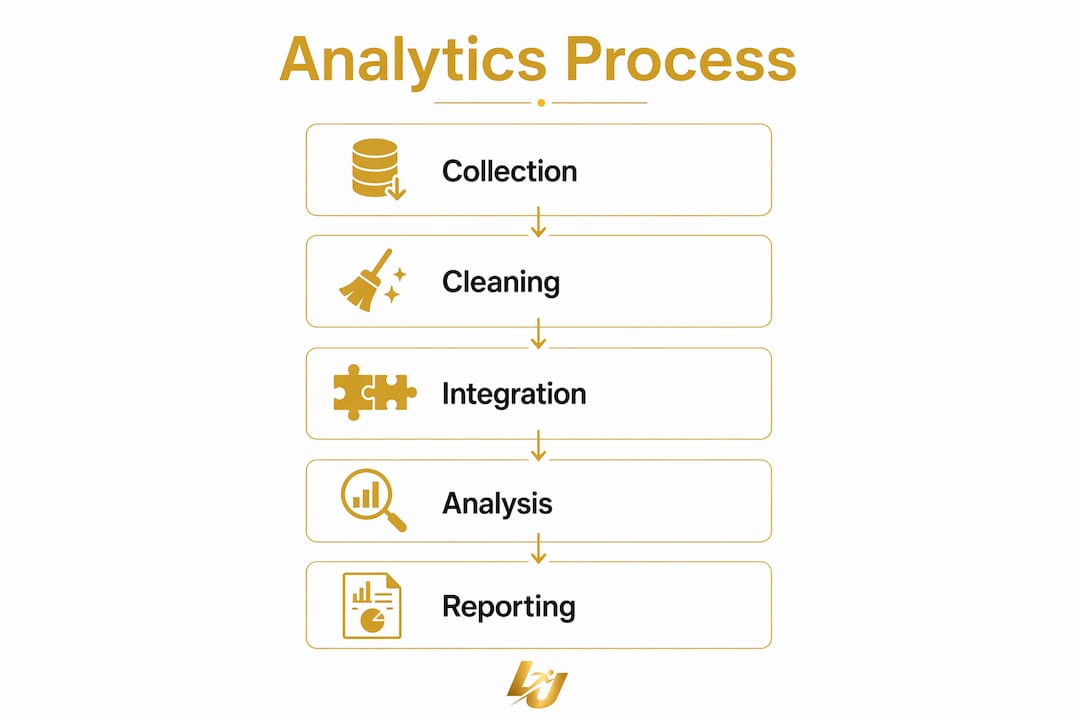
Once data is centralised, the processing pipeline follows four steps: collection, cleaning (removing duplicates and errors), aggregation into meaningful metrics, and continuous updating so dashboards reflect current reality. Visual analytics tools then present this information in formats that coaches, administrators, and board members can actually use without specialist training.
Pro Tip: Before selecting any analytics platform, audit which of your existing systems can export data via API. Platforms that connect natively to your current tools will save weeks of integration work and reduce the risk of data gaps.
Key use cases of analytics in club programmes
Analytics touches every part of a club’s operation, but six applications deliver the clearest returns.
Scouting and talent identification moves from subjective observation to objective tracking. Clubs that log speed, technical execution, and positional data across age groups can identify players whose development curves suggest future potential, not just current ability.

Match tactics and opponent analysis use historical performance data to spot patterns in opposition shape, set-piece tendencies, and pressing triggers. Coaches arrive at team meetings with evidence rather than impressions.
Player development monitoring tracks individual progress against benchmarks over time. When a player’s sprint speed plateaus or their technical scores stall, the data surfaces it before a coach notices it in training. Personalised programmes can then be adjusted accordingly.
Injury prevention and health management is where predictive analytics earns its keep. Monitoring training load, recovery metrics, and historical injury data allows medical staff to flag athletes approaching risk thresholds before they break down. This is particularly relevant in contact sports such as rugby and football, where load management directly affects availability.
Membership engagement and retention benefits from automated early-detection systems. A member who has not visited in 60 days no longer slips through unnoticed. Automated alerts flag inactivity and trigger personalised outreach, whether that is a targeted event invitation or a call from a membership coordinator, before the member decides to leave.
Programme planning and scheduling uses participation data to align session times, coaching resources, and facility allocation with actual demand rather than historical habit.
Enhancing decision-making culture with analytics in UK clubs
Technology alone does not change how a club operates. The clubs making the clearest gains are the ones where leadership has normalised data use in daily routines, not just quarterly board reviews. High-performing clubs shift from reactive damage control to proactive, strategy-led planning because their managers treat analytics as a standing agenda item, not an occasional exercise.
The DataHub, which integrates data across 200+ UK leisure centres, demonstrates what this looks like at scale. Operators use participation metrics and demographic benchmarks to target interventions, align programmes with local authority priorities, and evidence social value. That is analytics embedded in governance, not just operations.
56% of organisations report that data analytics leads to faster, more effective decision-making — a finding that holds across industries but is particularly consequential in club management, where decisions about staffing, pricing, and member engagement happen daily.
Cultural adoption requires a few specific conditions:
- Senior leaders reference data in meetings, modelling the behaviour they want from their teams
- Dashboards are role-specific, so a coach sees athlete metrics and a finance lead sees revenue trends, without either having to wade through irrelevant information
- Automated alerts reduce the cognitive load on staff by surfacing problems rather than requiring staff to go looking for them
- Decisions are reviewed against outcomes, creating a feedback loop that improves future choices
The shift from “what are the numbers?” to “what is our strategy?” is the marker of a club that has genuinely embedded analytics into its culture.
Best practices for integrating analytics into club decision workflows
Starting with too many metrics is the most common mistake. Clubs that try to track everything end up tracking nothing well. The better approach is to identify three to five decisions that recur weekly, then build dashboards around the data those decisions actually require.
Governance matters as much as technology. Assign clear ownership for each data stream: who is responsible for keeping membership records clean, who reviews the injury log, who updates session attendance. Without ownership, data quality degrades and dashboards become unreliable. A recruiting dashboard built on stale data produces worse decisions than no dashboard at all.
Integrate analytics into existing meeting rhythms rather than creating new ones. A Monday morning operations review that pulls from a live dashboard takes the same time as one built on manually compiled reports, but the conversation is about strategy rather than data collection. Review decisions against outcomes quarterly, and adjust the metrics you track as the club’s priorities evolve.
Examples of analytics tools and software used by sports clubs
UK clubs draw on a range of platforms depending on their size, sport, and budget.
Participation and benchmarking platforms such as the DataHub give leisure operators and national governing bodies access to sector-wide benchmarks, demographic mapping, and social value calculation across hundreds of facilities.
Integrated club management systems combine CRM, point-of-sale, booking, and financial reporting in a single environment. These platforms eliminate the data silos that force manual consolidation and give leadership a connected view of operations, finance, and member activity simultaneously.
Athlete development platforms such as Levelup360hq go further by adding performance analytics directly to the athlete experience. FIFA-style player cards with real-time ratings, XP-driven challenges, and video assessment workflows give coaches structured data on individual development while keeping athletes engaged with their own progress. The platform’s analytics capabilities support clubs across football, cricket, netball, and rugby, covering the full athlete ecosystem from junior development to senior squad management.
Wearable and GPS tracking systems feed load and movement data into injury prevention workflows, particularly in professional and semi-professional environments where marginal gains in availability translate directly to results.

Pro Tip: When evaluating any analytics tool, ask the vendor to show you a live dashboard built on data from a club similar to yours in size and sport. A demo built on generic sample data tells you very little about real-world usability.
Measuring the impact of analytics on programme outcomes and performance
The impact of analytics is only visible if you define what you are measuring before you start. Clubs that introduce dashboards without baseline metrics cannot tell whether anything has improved. Set a starting point for the metrics that matter most: member retention rate, session attendance, injury incidence, revenue per member, and staff hours spent on reporting.
Retention rate is often the most telling indicator. Clubs using proactive retention strategies driven by engagement data consistently reduce lapse rates compared to those relying on annual renewal reminders alone. Injury incidence tracked against training load data shows whether prevention protocols are working. Revenue per member, broken down by department, reveals which programmes generate genuine value and which are subsidised by the rest of the operation.
Operational efficiency is easier to quantify. If automated reporting reduces the time spent generating weekly summaries from several hours to under a minute, that is staff capacity redirected to coaching, member engagement, or programme development. Track it explicitly, because it is a return on the analytics investment that often goes unacknowledged.
Training and upskilling staff to leverage analytics effectively
Analytics tools are only as useful as the people using them. A dashboard that coaches do not trust, or that administrators find confusing, will be ignored within weeks of launch. Training needs to be role-specific: a coach needs to understand load metrics and development benchmarks, not database architecture.
Start with the decisions each role makes most often, then build training around the data those decisions require. Short, practical sessions work better than full-day workshops. A 30-minute walkthrough of a live dashboard, focused on a real scenario the coach or administrator has faced recently, builds confidence faster than abstract instruction.
Pair technical training with cultural reinforcement. When a senior coach references a player’s data in a team meeting, or a club manager cites retention metrics in a board presentation, it signals to the whole organisation that data use is expected and valued. Upskilling is not a one-off event. As platforms evolve and club priorities shift, regular refreshers keep staff capable and the data culture alive.
Why Levelup360hq puts analytics at the centre of club development

Levelup360hq is built for clubs that want analytics woven into the athlete experience, not bolted on as an afterthought. Real-time performance ratings, video assessment workflows, and XP-driven development tracking give coaches structured data on every athlete, while the platform’s CRM and subscription tools give club administrators the operational visibility they need to grow their programmes. Whether you run a football academy, a cricket club, or a multi-sport facility, Levelup360hq connects athlete development and club management in one environment. Explore the platform or see it in action with a live demonstration.
Key takeaways
Club analytics improves programme decisions by embedding the four-pillar framework of descriptive, diagnostic, predictive, and prescriptive analytics into daily club operations, enabling faster responses, better resource allocation, and measurable gains in retention and performance.
| Point | Details |
|---|---|
| Four-pillar framework | Descriptive, diagnostic, predictive, and prescriptive analytics used together reduce uncertainty and sharpen resource allocation. |
| Faster decision-making | 56% of organisations report analytics leads to faster, more effective decision-making after adoption. |
| Unified data platforms | Integrating all club data streams eliminates manual consolidation and delivers live dashboards in under a minute. |
| Retention through early detection | Automated alerts flag member inactivity before resignation, enabling personalised and timely outreach. |
| Culture over technology | Analytics delivers sustained value only when embedded in daily leadership routines, not treated as a periodic reporting exercise. |
Recommended
Turn potential into a player card.
LevelUp360 tracks every match, builds your child's player card, and shows their development over time.
Get started free