Evidence Led Churn Playbook for Sports Clubs: Boosted Trees, Checklist
Published 1 October 2026

Predicting member churn is practical once a club has recent attendance and payment data to work with, and once those predictions feed straight into an action. The three priorities are: capture attendance and payment history consistently, define a clear churn label, and run a short pilot using a boosted tree model on recent data. Done properly, this produces sharper outreach and measurably fewer members walking out the door.
TL;DR:
- A recent, high-quality dataset of attendance and payment history is essential to build a reliable churn prediction model for clubs.
- Boosted tree algorithms, trained on recent data windows, outperform older models and are the best choice for predicting member dropout accurately.
- Metrics such as out-of-time validation, precision, recall, and net revenue retention should guide model evaluation and operational deployment.
- Features like days since last visit, billing changes, engagement activities, and membership age are key predictors to focus on for effective risk scoring.
- Starting with manual outreach to flagged members and tracking simple KPIs like renewal and response rates is more effective than immediate automation.
Table of Contents
- Why churn prediction matters for clubs and what good looks like
- Which member signals predict churn and how to engineer them
- Models and evaluation: algorithms that work and validation best practice
- From prediction to retention: uplift, next-best-action and sample workflows
- Operational checklist: data governance, deployment and retraining cadence
- Practical example: how a gamified platform captures signals and closes the loop
- Author perspective: three practical priorities for club managers
- How LevelUp360HQ can help capture signals and automate retention workflows
- Sources
- FAQ
Why churn prediction matters for clubs and what good looks like
A member who stays six extra months is worth more than the cost of the campaign that kept them, and small retention gains compound over a membership base because every renewed member adds to lifetime value without adding acquisition cost. Clubs that treat churn as guesswork tend to discount everyone or no one; clubs that score risk tend to spend their retention budget where it changes outcomes.
The evidence from fitness settings is encouraging. Gradient boosting and random forest models built purely from usage logs, no surveys required, have reached very high accuracy predicting dropout, with non-attendance days, membership duration and total billed amount standing out as the strongest predictors. That matters operationally: clubs already hold this data in booking and billing systems, so the barrier is organisation, not new instrumentation.
A working system produces three outputs for each member: a risk score, a short explanation of what is driving it, and a recommended next action. Without the explanation, staff cannot trust the score; without the action, the score is just a number on a dashboard.
Track a short list of KPIs to judge whether the system earns its keep:
- Monthly churn rate among flagged high-risk members versus the rest of the base.
- Model precision and recall at the risk thresholds staff actually act on.
- Retention campaign response rate for contacted versus uncontacted at-risk members.
- Net revenue retained after accounting for offer or discount costs.
Which member signals predict churn and how to engineer them
Most churn signal comes from behaviour, not demographics. Build features around these four groups:
- Attendance and recency: days since last visit, visits in the last 7, 30 and 90 days, and the trend between those windows.
- Payment and billing: missed or late payments, total billed to date, and changes in plan tier or price paid.
- Engagement depth: class or session variety, participation in challenges or events, and interaction with coaches or staff.
- Tenure and demographics: months since joining, age band and, where relevant, the sport or programme enrolled in.
Non-attendance days, membership length and total billed amount consistently rank among the top predictive variables in fitness dropout studies, which is a useful starting point when a club has limited engineering time and needs to prioritise which fields to clean first.
Turning raw logs into usable features takes some care. Rolling aggregates (visits over the last 4, 12 and 26 weeks) capture trend better than a single lifetime count. Decay-weighted recency, where a recent visit counts more than one from months ago, tends to outperform a flat “last visit date” field. Binning last-visit gaps into categories such as 0 to 7 days, 8 to 30 days and 31-plus days often works better in tree-based models than a raw continuous number, because it matches how the model actually splits the data. Class-level ratios, such as the share of booked sessions actually attended, flag disengagement earlier than raw attendance counts alone.

Two warnings are worth taking seriously. First, label leakage: if a “cancelled membership” flag is set the same day a member stops attending, a model trained on that flag will look unrealistically accurate and fail in production. Build the churn label from a forward-looking inactivity window instead, so the model only ever sees information that would have been available before the member actually left. Second, sample size: a single-site club with a few hundred members will struggle to train a reliable model on its own; pooling data across locations, or starting with simpler rules until volume grows, avoids overfitting to noise.
Pro Tip: Build your churn label first and freeze its definition before touching any modelling, because changing the label halfway through a project invalidates every metric you have already calculated.
Models and evaluation: algorithms that work and validation best practice
Boosted tree models are the strongest performers reported in sport and fitness churn studies, and by a meaningful margin. In a study of season ticket holder behaviour, a CatBoost model reached an AUC-ROC of 0.901 when trained on a recent, shorter window rather than the full multi-season history, with boosted trees outperforming the other algorithm families tested in that study.
Logistic regression and simpler decision trees remain useful, mainly for their stability and interpretability. A logistic model’s coefficients are easy to explain to a front-desk team; a single decision tree can be printed and pinned to a wall. Neither typically matches a well-tuned gradient boosting or random forest model on raw predictive accuracy, but both are reasonable starting points when data volume is limited or when staff need to understand exactly why a score moved.
Validation is where most club projects go wrong. Splitting data randomly across the full history overstates performance, because the model effectively gets to peek at patterns from periods it will never see again in practice. Out-of-time validation, training on an earlier window and testing on a later one, gives a realistic read on how the model will perform going forward. This matters even more after a disruptive period: shorter, recent windows outperformed a full six-season model in the season ticket holder study, largely because member behaviour drifted enough that older data actively misled the model.
Report these metrics, and interpret them operationally rather than academically:
- AUC-ROC tells you how well the model ranks at-risk members against safe ones, useful for prioritising a contact list.
- Precision at your action threshold tells you what share of flagged members were genuinely worth contacting, which controls wasted staff time.
- Recall tells you what share of members who actually churned were caught in time to intervene.
Boosted trees trained on a recent window reached an AUC-ROC of 0.901, a level that supports genuinely prioritised outreach rather than blanket campaigns.
From prediction to retention: uplift, next-best-action and sample workflows
A risk score tells you who is likely to leave. It does not tell you who will actually respond to an intervention, and those are different questions. Uplift modelling closes that gap by estimating the difference an action makes for a given member, rather than just their baseline risk.
A practical way to build this is a Two-Model T-Learner: train one model on members who received an intervention and one on members who did not, then compare their predicted outcomes for each member. The gap between the two predictions estimates the member’s individual uplift, letting you separate “persuadables” (who respond well to contact) from members who would have stayed anyway or who will leave regardless. Combining this uplift estimate with expected value constraints reduced unnecessary interventions and improved campaign economics in retention experiments reviewed in recent CRM research.
Once uplift and risk are both available, prioritise contacts by combining them rather than acting on risk alone:
- High risk, high uplift: contact first, these are the members most likely to leave and most likely to respond.
- High risk, low uplift: deprioritise or use a low-cost touch, since intervention is unlikely to change the outcome.
- Low risk, high uplift: worth a light-touch offer if capacity allows, since encouragement here is cheap and reinforces loyalty.
Three workflows put this into practice without heavy engineering. An automated email with a personalised offer works well for members flagged as high risk with moderate uplift, and success is measured by renewal rate among the contacted group versus a held-out control. A direct coach or staff outreach call suits high-value or long-tenure members where a personal touch outperforms an automated message, measured by response rate and subsequent attendance. A re-engagement challenge, a short XP-driven or points-based activity, suits members whose attendance has dipped but who remain engaged with the club’s community features, measured by return-to-attendance within two to four weeks.
Pro Tip: Always hold back a small control group from every retention campaign, otherwise you will never know whether the offer worked or the member would have stayed anyway.
Operational checklist: data governance, deployment and retraining cadence
Getting a model into production is less about algorithms and more about discipline around data and timing.
- Define churn using a business-justified inactivity window (for example, 45 days with no visit and no active booking) rather than an arbitrary cut-off.
- Collect explicit consent for using member data in analytics and keep personally identifiable fields separate from the modelling dataset.
- Set a minimum sample size before trusting model output, a few hundred churned examples is a reasonable floor for a first pilot.
- Integrate the model’s output directly into the CRM and booking system so risk scores appear where staff already work.
- Retrain on a fixed cadence, monthly or quarterly is typical, and retrain immediately after a disruptive event such as a facility closure or major price change.
- Monitor for drift by tracking prediction accuracy on new data each month and flagging a meaningful drop for investigation.
| Checklist item | Recommended approach |
|---|---|
| Churn label | Inactivity window agreed with staff, not an arbitrary date |
| Minimum sample | A few hundred churned examples before trusting output |
| Retraining cadence | Monthly or quarterly, plus after major disruptions |
| Validation method | Out-of-time testing on a recent, held-out window |
Practical example: how a gamified platform captures signals and closes the loop
Some of the richest churn signal comes from features clubs already offer for engagement rather than analytics. A gamified athlete development platform illustrates how this works in practice.
- Live player cards and real-time ratings generate a steady stream of activity data that reflects whether an athlete is actually engaging with their development, not just showing up.
- XP-driven challenges and tier progression produce completion and frequency data that doubles as an early engagement signal, since disengagement usually shows up here before it shows up in attendance.
- Badge systems and leaderboards create social engagement data, participation in community features often precedes or follows changes in attendance.
- CRM and subscription management tools let a club act on a risk signal immediately, sending a targeted message or offer without switching systems.
Because attendance-adjacent behaviour is tracked alongside billing and subscription status, it captures several of the feature groups a churn model needs by default, rather than requiring a club to build separate instrumentation from scratch.
Author perspective: three practical priorities for club managers
Most clubs overthink the modelling and underthink the pilot. Start small: pull twelve months of attendance and payment data, define churn as a fixed inactivity window, and train a single boosted tree model before considering anything more elaborate.
Resist the urge to automate outreach immediately. Manually contact a handful of flagged members first and see whether the intervention actually changes their behaviour, because a model that ranks risk well can still point you toward the wrong action.
Track renewal rate and response rate, nothing more exotic, and treat a small, consistent improvement as a win rather than chasing marginal gains in model accuracy that rarely translate into retained members.
— Chris
How LevelUp360HQ can help capture signals and automate retention workflows
Most of the effort in churn prediction goes into collecting and organising data before a single model gets trained, and that is exactly where a platform built around engagement tracking saves time. LevelUp360HQ records attendance-adjacent activity, XP progression, challenge completions and subscription status in one system, so a club does not need to stitch together a booking tool, a spreadsheet and a payment processor before it can even start.
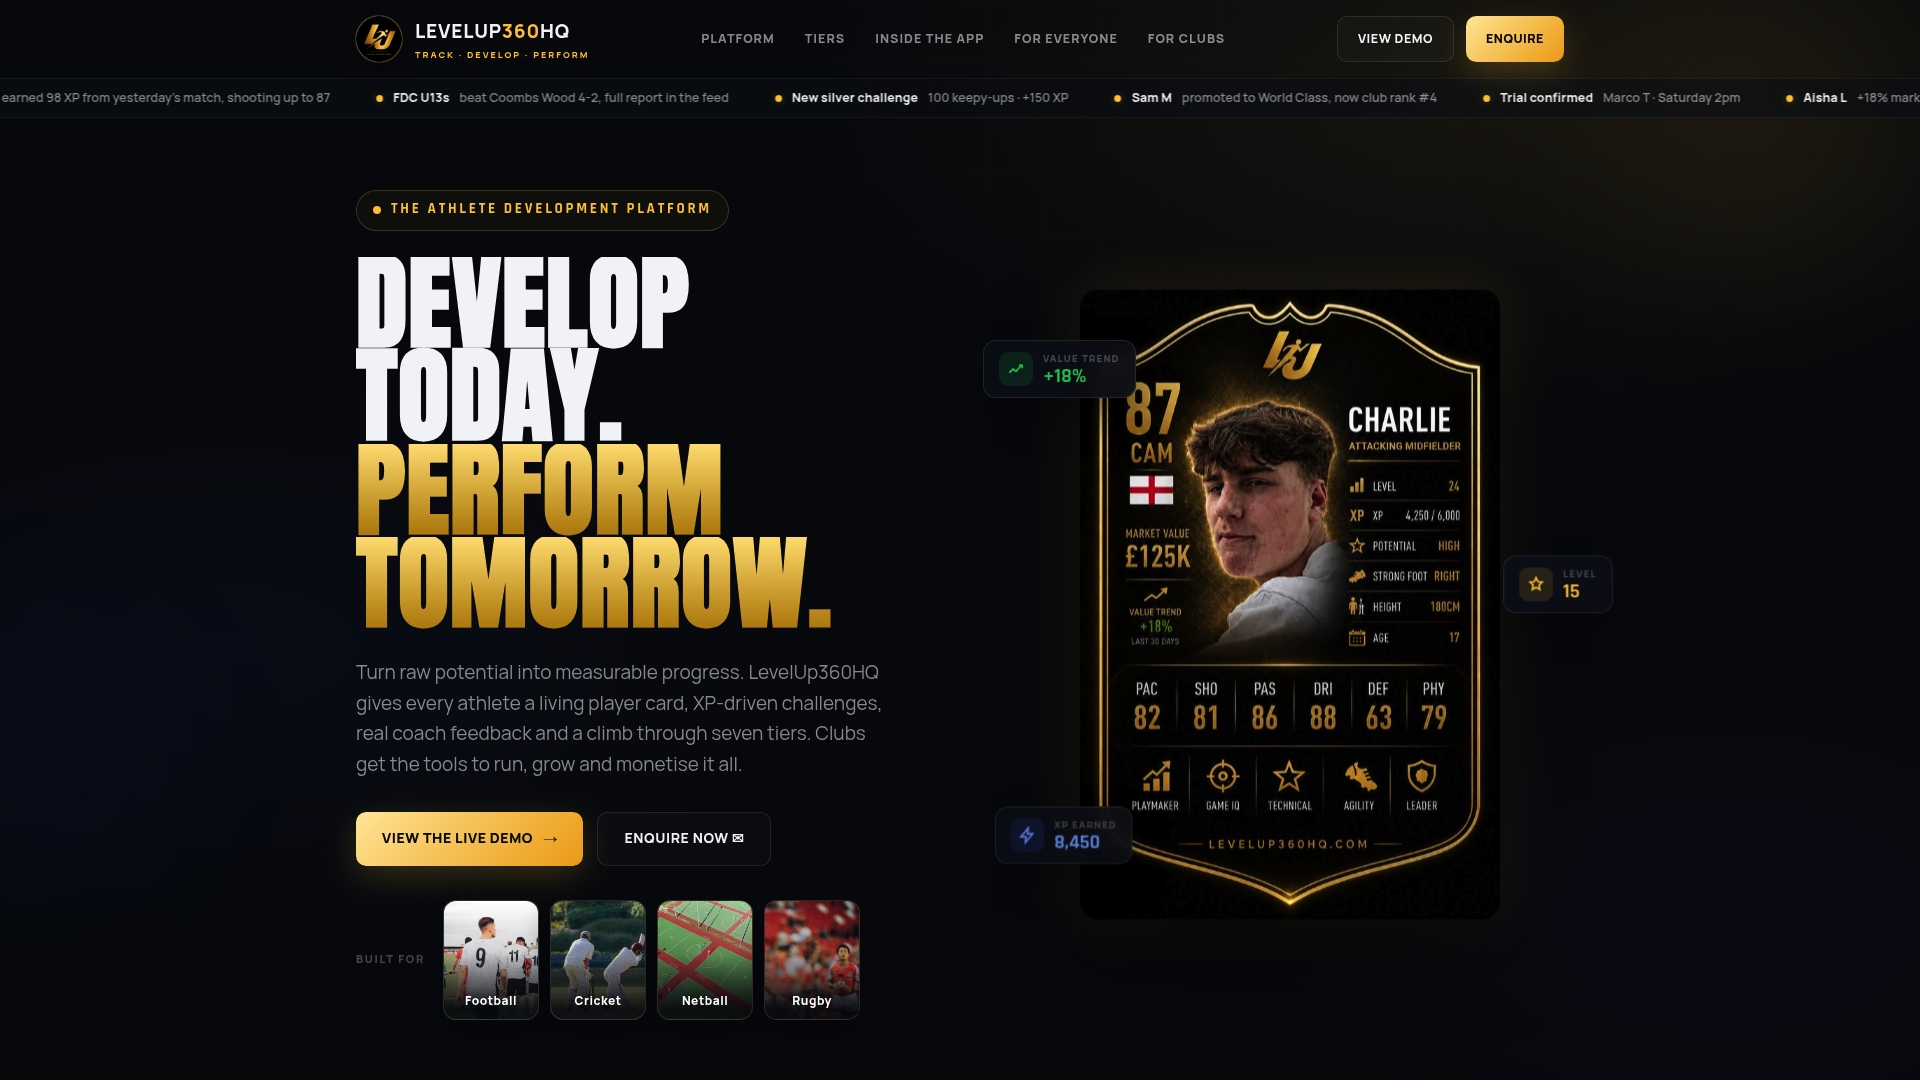
CRM and subscription management tools mean a risk signal can trigger a message, offer or coach outreach without leaving the system, and a white-label setup lets a club present all of this under its own branding. For a club that wants to test the workflows described here without building them from scratch, the demo page is a practical starting point, or visit the LevelUp360HQ home page to see the full platform.
Sources
- Machine learning and churn: predicting season ticket holder behaviour
- Predicting fitness centre dropout (PMC)
- AI‑Driven recommendation framework for customer retention in CRM platforms (Aalto thesis)
FAQ
What is meant by churn prediction?
Churn prediction is the use of historical member data, typically attendance, payments and engagement, to estimate which members are likely to cancel or stop attending in the near future. The output is usually a risk score per member rather than a single yes or no answer, which lets staff prioritise outreach.
Can AI predict the outcome of sporting events?
Predictive models are applied across sport for various purposes, including athlete and member behaviour rather than only match outcomes; the studies referenced in this article focus specifically on membership and season ticket churn rather than game results. Accuracy depends heavily on the quality and recency of the data used, as seen in the dropout prediction research cited above.
What are the current trends in the sports industry?
Within retention analytics specifically, the clearest trend is a move towards shorter, more recent training windows and boosted tree models, which have shown stronger performance than older multi-season approaches in season ticket holder research. There is also a shift from producing risk scores alone towards linking them directly to automated retention actions.
Which companies are the best for sports analytics?
This varies widely by sport and use case, and no single provider fits every club’s needs, so it is not possible to name a definitive best option. Clubs generally do better evaluating providers against their own data quality, integration needs and budget than following a generic ranking.
How much member data do I need before building a churn model?
A reasonable starting point is a few hundred examples of churned members alongside a comparable pool of retained members, collected over at least twelve months. Below that volume, simpler rule-based flags, such as a fixed inactivity window, tend to be more reliable than a trained model.
Turn potential into a player card.
LevelUp360 tracks every match, builds your child's player card, and shows their development over time.
Get started free