How athlete progression data benefits scouts and coaches
Published 7 August 2026

Athlete progression data converts observation into measurable trajectories, giving scouts and coaches the evidence they need to identify talent earlier, evaluate it more accurately, and make development decisions that hold up under scrutiny. Rather than relying on a single standout performance, you build a picture of how an athlete moves over time, and that slope tells you far more than any snapshot.
TL;DR
- Progression data reveals consistent improvers and late developers that single-session scouting misses.
- Combining external load, internal load, and wellbeing metrics reduces false positives when flagging over-reach or under-development, as athlete monitoring research confirms.
- Earlier injury-risk signals mean fewer costly recruitment mistakes and more targeted interventions.
- A big data analytics framework study reported a reduction in hamstring injuries in football when integrated analytics were applied.
Your next step this week: pick five prospects, select three role-specific KPIs, and track them consistently for six weeks. That pilot will produce more defensible data than a season of unstructured observation.
Pro Tip: Before you choose your KPIs, write down the one question you most need answered about each prospect. The metric that answers that question is the one worth tracking.
Table of Contents
- What does progression data actually change for scouts?
- Which metrics should scouts actually track?
- How do you turn repeated measures into a decision?
- How do you build a scouting workflow around progression data?
- Why explainability matters as much as accuracy
- Common pitfalls that undermine progression analytics
- Decision rules scouts should apply to every profile
- How a UK club could operationalise this with Levelup360hq
- Key takeaways
- The gap between data collection and data use
- Levelup360hq turns progression data into decisions your club can act on
- Useful sources for further reading
What does progression data actually change for scouts?
The honest answer: it changes what you can defend. Scouts have always had opinions. What progression data gives you is the ability to show why you rated a player, with a trajectory rather than an impression.
Take late developers. A 15-year-old who is physically behind his cohort but whose technical metrics are climbing steeply is routinely missed by scouts relying on cross-sectional comparison. Progression data catches him because it separates biological maturity from skill acquisition rate. That distinction has real consequences for academy recruitment, where the cost of missing a late developer is not just one player — it is the cumulative effect of systematically favouring the early-maturing athlete.

Evaluation accuracy improves for a related reason. A single match is noisy. Weather, opposition quality, match minutes, and the athlete’s sleep the night before all contaminate the reading. Repeated measures across weeks smooth that noise. You stop asking “was that a good performance?” and start asking “is this athlete performing better than they were three months ago, and at what rate?”
Development planning becomes more targeted when you have measured deficits rather than impressions. If an athlete’s aerobic capacity is tracking below their cohort percentile while their technical metrics are strong, the intervention is specific: conditioning work, not technical coaching. Without the data, a coach guesses. With it, they prescribe.
Recruitment ROI is the benefit that tends to convince club administrators. Signing an athlete on the basis of a progression trajectory rather than a peak performance reduces the risk of regression after signing. The JSSM systematic review on machine learning in talent identification found that multidimensional data models surface patterns across attributes that single-metric or impression-based approaches miss, though the review is equally clear that model validation and transparency are non-negotiable.
Which metrics should scouts actually track?
The temptation is to track everything. Resist it. Performance measurement research argues that measures should be selected to answer specific managerial questions, not collected indiscriminately. A bloated KPI list masks signal in noise. Pick a small set aligned to the role profile you are recruiting for.
Here is a practical shortlist, organised by category:
External workload (GPS-derived)
- Total distance per session or per 90 minutes
- High-speed running distance (typically above 5.5 m/s in football)
- Acceleration and deceleration counts (a proxy for explosive demand and fatigue)
Internal load
- Heart rate: average, peak, and time in zones
- Heart rate variability (HRV) as a recovery and readiness indicator
- Session rating of perceived exertion (sRPE): multiply session RPE by duration for a simple load unit
Technical and tactical measures (sport-specific)
- Successful actions per 90 minutes (passes completed, duels won, interceptions)
- Decision speed under pressure (video-coded)
- Pass type distribution (progressive, lateral, backward) for positional roles
Physical development
- Maturity offset and growth velocity (critical for youth athletes)
- Rate of force development (RFD) from jump or isometric testing
- Peak power output from sprint or cycle ergometer testing
Wellbeing and readiness
- Daily or weekly wellness surveys (fatigue, mood, sleep quality, muscle soreness)
- Illness and injury log entries
- Sleep duration where self-reported or wearable-derived
The athlete monitoring literature is consistent on one point: viewing external workload, internal load, and perceptual wellbeing together gives a more accurate picture of athlete status than any single dimension. A player whose GPS numbers look fine but whose sRPE is spiking and HRV is dropping is at risk. You would not see that from GPS alone.
Pro Tip: Map each KPI to a specific role requirement before you start collecting. A central midfielder’s KPI set should look different from a centre-back’s. Generic athlete profiles produce generic decisions.
How do you turn repeated measures into a decision?
The shift from data collection to decision-making comes down to one concept: trajectories over snapshots. The current value of a metric matters less than the direction and rate of change. A player whose sprint speed is 7.8 m/s and improving at 0.1 m/s per month is a better prospect than one sitting at 8.2 m/s and flat.
Rate of change and smallest worthwhile change
A simple rate-of-change calculation: subtract the first measurement from the most recent, divide by the number of months between them. That gives you a monthly change figure you can compare across athletes and against cohort norms.
The more nuanced tool is the smallest worthwhile change (SWC), drawn from athlete monitoring methodology. The SWC is typically set at 0.2 multiplied by the within-athlete standard deviation for that metric. Any change smaller than the SWC is likely noise; any change larger is worth acting on. This approach, recommended in the BJSM athlete monitoring guide, shifts you away from asking “did the number go up?” and towards asking “did it go up by enough to mean something?”
Age adjustment and maturity
Youth athlete data is almost meaningless without maturity adjustment. Two 14-year-olds can differ by two or three years in biological age, making raw physical comparisons misleading. Maturity offset, calculated from standing height, sitting height, and body mass, estimates how far an athlete is from peak height velocity. Once you have that offset, you can express physical metrics as age-adjusted percentiles and compare athletes on a level basis.
Benchmarking against cohorts
A useful progression chart shows three things: the athlete’s individual data points over time, a trend line, and the cohort band (typically the 25th–75th percentile range for that role and age group). An athlete tracking in the bottom quartile but with a steeper positive slope than the cohort average is a different proposition from one sitting in the top quartile and plateauing.
| Scenario | Trajectory | Recommended action |
|---|---|---|
| Below cohort median, steep positive slope | Improving faster than peers | Monitor closely; consider pathway promotion |
| Above cohort median, flat or declining | Plateauing | Investigate load, wellbeing, and training context |
| Below cohort median, flat | Stagnant | Review intervention; consider role or pathway fit |
| Above cohort median, steep positive slope | Excelling | Fast-track assessment; prioritise for selection |
Performance metrics guidance from ASQ recommends control charts for detecting meaningful shifts in longitudinal data, a technique directly applicable to athlete monitoring: plot the metric over time, add control limits based on within-athlete variability, and flag any point that falls outside those limits as requiring investigation.
How do you build a scouting workflow around progression data?
Good data collection does not happen by accident. It requires defined roles, a consistent cadence, and a clear answer to the question: who owns this?
Roles and responsibilities
| Role | Responsibility |
|---|---|
| Scout | Define the questions, select KPIs, review trajectory summaries |
| Coach | Collect session data, submit sRPE and wellness inputs, flag context |
| Sports scientist | QA data, calculate SWC, produce trend outputs |
| Data custodian | Manage consent, storage, access controls, and GDPR compliance |
Data quality checklist
Dirty data produces misleading trajectories. Before any analysis, check:
- Timestamps are consistent and in the same time zone
- Testing conditions are standardised (same time of day, same equipment, same warm-up protocol)
- GPS devices are calibrated and firmware is current
- Wellness surveys are completed before training, not retrospectively
- Missing data points are logged as missing, not imputed with zeros
UK compliance: GDPR practical notes
For youth athletes, written consent from a parent or guardian is required before collecting any personal data, including performance metrics. Under UK GDPR, you must:
- Collect only the data you have a stated purpose for (data minimisation)
- Store data securely, with access limited to those with a legitimate need
- Have a clear retention policy (how long data is kept and when it is deleted)
- Be able to provide a copy of an athlete’s data on request
When sharing data with parents, use a secure portal or encrypted file rather than email. Athlete management systems that centralise data and enforce role-based access controls, as described in Firstbeat’s AMS guidance, reduce the compliance burden considerably compared to spreadsheet-based approaches.
Tools: when to escalate from spreadsheets
Spreadsheets work for a pilot of five to ten athletes. Beyond that, the manual overhead becomes a data quality risk. A dedicated athlete management system or platform adds automated alerts, role-based access, and visual dashboards that make trend data accessible to coaches who are not comfortable with raw numbers. The MDPI big data analytics framework recommends interpretable dashboards as a core feature of any analytics implementation, precisely because adoption depends on coaches being able to read the output without a statistics degree.
Why explainability matters as much as accuracy
A model that produces accurate predictions but cannot explain them is, for most scouts and coaches, useless. If you cannot tell a head coach why the data recommends promoting an athlete, the recommendation will be ignored. Explainability is not a nice feature. It is the condition for adoption.
The JSSM review is explicit: ML models used in talent identification must be validated and transparent. A black-box score attached to a player profile does not meet that standard.
Common pitfalls that undermine progression analytics
Data noise from too many metrics
Collecting twenty KPIs when you have the capacity to act on five produces a dashboard that nobody reads. Athlete monitoring research specifically warns against this: too many signals mask the meaningful ones. Define your KPI set before you start collecting, not after.
Selection and survivorship bias
Cohort benchmarks built from athletes who stayed in the programme are biased towards survivors. Athletes who were released early are absent from the data, which means the benchmark reflects selection decisions already made rather than true population norms. Acknowledge this when interpreting percentile comparisons.
Overfitting to short windows
Six weeks of data is enough for a pilot decision, not enough to build a predictive model. Performance measurement guidance warns against drawing strong conclusions from small samples. A negative slope over three data points might be a bad week, not a trend.
Ignoring context
A drop in GPS output during a week when an athlete had three matches and a family bereavement is not a performance signal. Training load, match minutes, illness, and life stressors all affect metrics. Log context alongside data, and treat unexplained drops differently from drops with a documented cause.
Mitigation tactics
- Predefine the questions your data must answer before selecting metrics.
- Run a stakeholder analysis: ask coaches, athletes, and medical staff what decisions they need data to support, as recommended by HDSR performance measurement research.
- Set a minimum observation window (at least six data points per metric) before drawing trajectory conclusions.
- Always record context notes alongside metric entries.
Decision rules scouts should apply to every profile
Screening questions for every athlete profile
- Does the athlete have at least six data points per KPI across a minimum of six weeks?
- Are the metrics role-specific, or are you comparing a winger against a centre-back benchmark?
- Has maturity offset been calculated and applied for youth athletes?
- Is the trajectory positive, flat, or negative, and is the rate of change above the SWC?
- Do external load, internal load, and wellbeing data tell a consistent story, or are they contradicting each other?
- Is there a documented context explanation for any sudden drops?
Red flags to escalate immediately
- A sudden negative slope in two or more KPIs simultaneously (possible overtraining or injury onset)
- Persistent mismatch between external load (GPS looks normal) and internal load (sRPE and HRV both elevated): a classic early overreach signal
- Wellness scores below the athlete’s individual baseline for more than five consecutive days
- Zero improvement across all KPIs over a full season despite consistent training exposure
The 4-2-1 progression heuristic
Adapted for scouting contexts, the 4-2-1 rule works as follows:
- 4 KPIs tracked across the full assessment period
- 2 must show a positive trajectory above the SWC to trigger a promotion review
- 1 must be a physical or technical metric directly linked to the target role
This keeps decisions grounded in multiple signals while avoiding the paralysis of requiring improvement across every dimension simultaneously. An athlete who improves in two of four KPIs, including the role-critical one, is worth a structured conversation. One who improves in four out of four is a priority.
Converting a trajectory to a recruitment decision
| Trajectory profile | Decision |
|---|---|
| 3–4 KPIs positive, above SWC, role-critical metric included | Recommend for selection or pathway promotion |
| 2 KPIs positive, role-critical metric included | Conditional: extend monitoring for four weeks |
| 1 KPI positive or role-critical metric flat | Hold: review training context and intervention |
| 0 KPIs positive, red flags present | Escalate to medical and coaching review |
How a UK club could operationalise this with Levelup360hq
Here is what a practical six-to-twelve-week pilot looks like for a UK academy or club using Levelup360hq.
Pilot timeline
| Week | Milestone | Owner |
|---|---|---|
| 1 | Define KPI set, role profiles, and SWC thresholds; onboard athletes and collect consent | Scout / data custodian |
| 2 | Baseline assessment; configure player cards and dashboard alerts | Sports scientist / coach |
| 3–5 | Weekly data collection: GPS, sRPE, wellness surveys, video clips | Coach |
| 6 | Mid-point review: calculate rate of change; apply 4-2-1 heuristic; flag red flags | Scout / sports scientist |
| 7–10 | Continue collection; refine alert thresholds based on mid-point findings | Coach / sports scientist |
| — | End-of-pilot review: trajectory summaries, pathway recommendations, pilot evaluation | Scout / head coach |
Expected outcomes
- Clearer, evidence-backed promotion and selection decisions by week 12
- Fewer reactive injury responses, because load and wellbeing alerts surface risk earlier
- Improved athlete engagement: the gamified player card and XP system on Levelup360hq gives athletes a visible stake in their own progression, which tends to improve data quality (athletes who care about their card complete their wellness surveys)
- A documented pilot dataset that justifies scaling to the full squad
The scale decision is straightforward: if the pilot produces at least two defensible pathway decisions that would not have been made without the data, the case for full deployment is made. That is a low bar, and in practice most pilots clear it.
Key takeaways
Progression data is only as useful as the decisions it changes: define your questions first, collect the minimum viable KPI set, and act on trajectories rather than snapshots.
| Point | Details |
|---|---|
| Start with questions, not data | Define the scouting question each KPI must answer before collecting anything. |
| Track trajectories, not snapshots | Rate of change above the smallest worthwhile change is the signal worth acting on. |
| Combine three data dimensions | External load, internal load, and wellbeing together reduce false positives in athlete assessment. |
| Apply maturity adjustment for youth | Maturity offset is required to compare youth athletes fairly across biological ages. |
| Use Levelup360hq to operationalise | Levelup360hq’s player cards, KPI dashboards, and GDPR controls provide a ready pilot infrastructure for UK clubs. |
The gap between data collection and data use
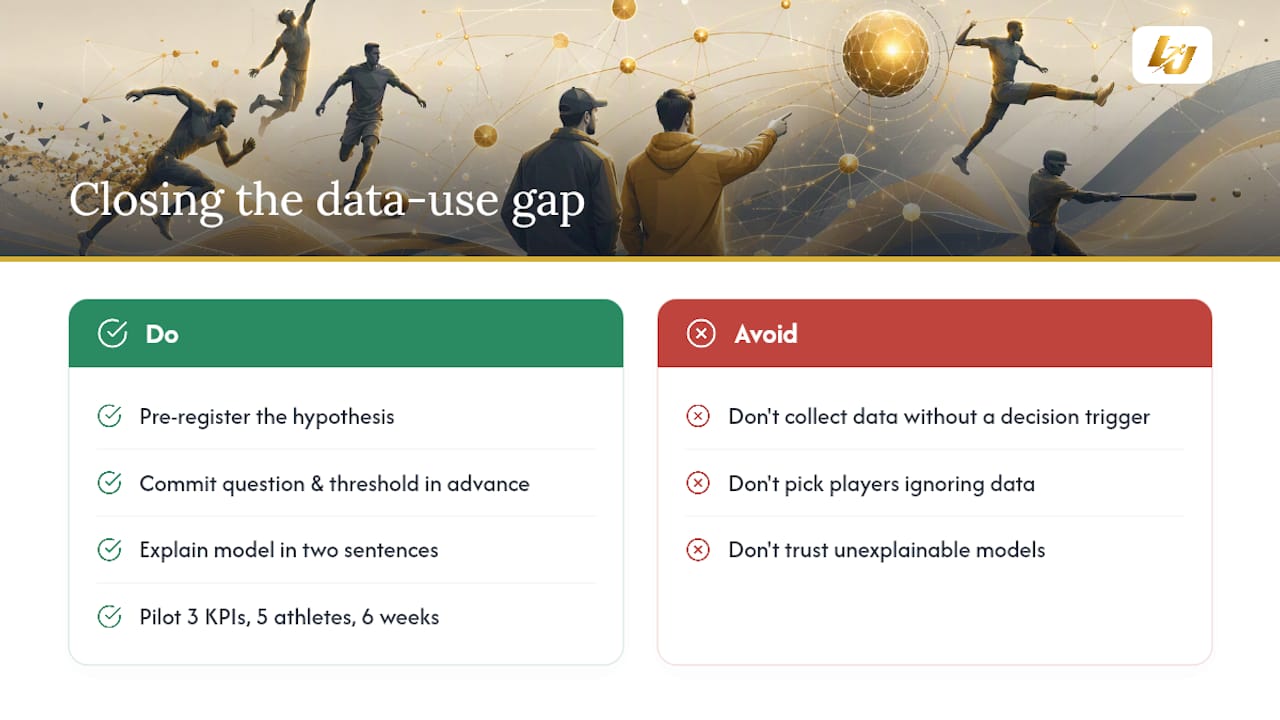
There is a version of this that goes wrong in almost every club that tries it: they buy the GPS vests, set up the spreadsheet, collect twelve weeks of data, and then make exactly the same decisions they would have made without any of it. The data sits there. Nobody looks at it between sessions. The coach still picks the player who looked good on Tuesday.
The problem is not the data. It is the absence of a decision trigger. Progression analytics only changes behaviour when someone has committed, in advance, to the question the data will answer and the threshold that will prompt action. Without that, you are not doing data-driven scouting. You are doing data-accompanied scouting, which is a different thing entirely.
The scouts who get the most from progression data are the ones who treat it like a pre-registered hypothesis: “If this athlete’s high-speed running distance improves by more than the SWC over six weeks, I will recommend them for pathway promotion.” That commitment, made before the data is collected, is what turns a dashboard into a decision.
The other thing worth saying plainly: explainability is not a concession to technophobia. It is a quality standard. A model output you cannot explain to a head coach in two sentences is a model output you should not trust yourself. The JSSM review’s insistence on transparency is not about making analytics accessible to non-technical staff. It is about making sure the analyst understands what the model is actually doing.
Start small. Three KPIs, five athletes, six weeks. That is enough to build the habit, demonstrate the value, and earn the budget for the next phase.
Levelup360hq turns progression data into decisions your club can act on
Most clubs already have the data. What they lack is a system that surfaces it at the right moment, in a format coaches will actually use.
Levelup360hq is built for exactly that gap. The platform’s live player cards give scouts and coaches a real-time trajectory view for every athlete, updated automatically as GPS, wellness, and assessment data comes in. KPI dashboards are configurable by role profile, so a football academy and a cricket programme can run entirely different metric sets on the same platform. Video assessment tools with approval workflows add the qualitative layer that pure numbers miss.

GDPR consent management, role-based access, and secure parent-facing views are built in, which removes the compliance overhead that makes spreadsheet-based approaches risky for UK clubs working with youth athletes.
The pilot path is low-friction: book a demo to see the platform configured for your sport and squad size, or visit Levelup360hq to explore the full feature set. Most clubs are collecting meaningful trajectory data within two weeks of onboarding.
Useful sources for further reading
-
Big data analytics framework for decision-making in sports performance optimisation — An MDPI framework paper covering wearables, video tracking, and predictive models. Includes case scenarios across football, basketball, and athletics, and makes a strong case for interpretable dashboards.
-
The role of machine learning in talent identification for sport (JSSM review) — A peer-reviewed systematic review of ML applications in talent identification. Balanced on both the potential and the validation requirements; recommended for anyone considering model-based scouting tools.
-
Why measure performance? Different purposes require different measures — A management science paper that applies directly to sports scouting: the argument that measures must be selected to answer specific questions, not collected for completeness, is one of the most practically useful frameworks in this space.
-
Why performance measurement matters and how to design useful metrics (HDSR / MIT Press) — Covers metric design, stakeholder analysis, and the risk of perverse incentives from poorly chosen KPIs. Useful for the pitfalls section of any scouting analytics project.
-
Performance metrics and measurement guidance (ASQ) — Quality management tools including control charts and analysis plans, directly applicable to longitudinal athlete data. Useful for anyone building a monitoring dashboard and wanting a rigorous framework for detecting meaningful shifts.
Recommended
Turn potential into a player card.
LevelUp360 tracks every match, builds your child's player card, and shows their development over time.
Get started free